


This article is part of our According to the Data series.
Who hasn't heard of the third year WR's jump in production? I think most of us have, and it makes sense. It takes time to learn an offense and get acclimated to the competition in the NFL. However, I thought this question was ripe for analysis, because I always hear this adage around draft time. Here is the question: Do 3rd year WR´s really see a significant bump in production?
Data
I gathered the top 100-WR receivers from 1977 to 2013 from NFL.com. I filled in seasons prior to 1977 for players who played in the 1977 season. In total, the data set represents 1,454 players and 6,046 seasons spanning data from 1964 to 2013. However, since we are looking for the production difference between years 2 and 3, I removed any player whose career was shorter than 3 seasons. (Note: this three-year filter cut the number of players by 45 percent which means a little more than half the WR over the last 35-plus years had careers longer than three years.) The next step was identifying all the receivers whose careers included at least one season meeting one of the three criteria: 30 receptions, 400 yards receiving or five touchdowns. This filter pared the data down to 559 players and 4,381 seasons. The season-long data collected were receptions, receiving yards, and touchdowns.
Analysis
To examine the production between the seasons, the season data was labeled 1 through the number of seasons played for the various players. The season
Who hasn't heard of the third year WR's jump in production? I think most of us have, and it makes sense. It takes time to learn an offense and get acclimated to the competition in the NFL. However, I thought this question was ripe for analysis, because I always hear this adage around draft time. Here is the question: Do 3rd year WR´s really see a significant bump in production?
Data
I gathered the top 100-WR receivers from 1977 to 2013 from NFL.com. I filled in seasons prior to 1977 for players who played in the 1977 season. In total, the data set represents 1,454 players and 6,046 seasons spanning data from 1964 to 2013. However, since we are looking for the production difference between years 2 and 3, I removed any player whose career was shorter than 3 seasons. (Note: this three-year filter cut the number of players by 45 percent which means a little more than half the WR over the last 35-plus years had careers longer than three years.) The next step was identifying all the receivers whose careers included at least one season meeting one of the three criteria: 30 receptions, 400 yards receiving or five touchdowns. This filter pared the data down to 559 players and 4,381 seasons. The season-long data collected were receptions, receiving yards, and touchdowns.
Analysis
To examine the production between the seasons, the season data was labeled 1 through the number of seasons played for the various players. The season data were then averaged for all 559 players over the 4,381 seasons to produce "average" season receptions, receiving yards, and touchdowns for all the seasons which had a player. These average statistics will be used to determine if there is a jump in production from year 2 to 3 by looking at a percentage increase (or decrease) from year to year. This percentage should either prove or disprove the 3rd year jump.
Results
| Row Labels | Count of ID | Average of Rec | Average of Yds | Average of TD |
| 1 | 559 | 21.4 | 321.4 | 2.0 |
| 2 | 559 | 32.9 | 492.6 | 3.1 |
| 3 | 559 | 37.1 | 549.2 | 3.6 |
| 4 | 527 | 39.8 | 575.9 | 3.5 |
| 5 | 477 | 39.9 | 573.3 | 3.5 |
| 6 | 406 | 38.9 | 556.4 | 3.5 |
| 7 | 343 | 40.2 | 570.0 | 3.6 |
| 8 | 279 | 41.2 | 584.2 | 3.6 |
| 9 | 218 | 41.3 | 575.3 | 3.4 |
| 10 | 155 | 42.6 | 585.6 | 3.9 |
| 11 | 106 | 43.6 | 614.1 | 3.6 |
| 12 | 74 | 43.9 | 622.9 | 4.1 |
| 13 | 49 | 40.1 | 553.9 | 3.6 |
| 14 | 30 | 42.7 | 591.0 | 3.5 |
| 15 | 18 | 43.1 | 556.3 | 3.2 |
| 16 | 13 | 25.6 | 310.2 | 1.8 |
| 17 | 5 | 42.0 | 569.8 | 4.4 |
| 18 | 2 | 63.0 | 825.5 | 4.5 |
| 19 | 1 | 63.0 | 869.0 | 2.0 |
| 20 | 1 | 25.0 | 362.0 | 3.0 |
| Grand Total | 4381 | 36.6 | 528.9 | 3.3 |
This data is interesting, but the chart below provides a clearer representation:
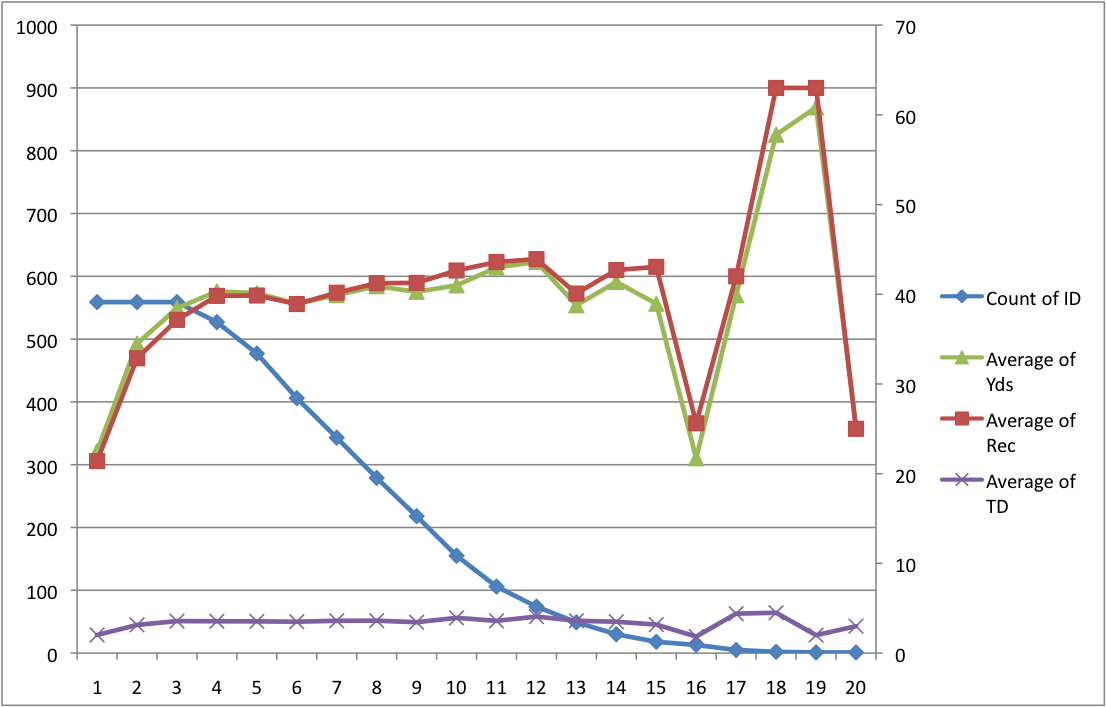
Surprisingly, the biggest jump does not actually occur between Years 2 and 3 but rather between Years 1 and 2. Between Years 1 and 2 there is an increase of more than 50 percent across all three measures - receptions, receiving yards and touchdowns. While there's an increase between Years 2 and 3 which is around 12 percent for the three measures, it's not nearly as big. From seasons 4 to about 12, production is stable with some variation. It should be noted in year 10, there are only 155 players left from the original data set of 1,454. This equates to about 10 percent. I mention this because the data from season 10 and beyond represents the top 10 percent of all the data. This means these players are the elite of the elite, so they should not be used to develop a general forecasting model.
Conclusion
The data indicate the biggest production jump for receivers occurs between Years 1 and 2. The growth continues until Year 4 and then plateaus until about Years 9 or 10. (Of course, there is likely some survivor bias here with only the better players remaining in the league for so long.) That bias is even more pronounced for those receivers who play beyond year 11, as these seasons are statistical outliers, representing less than eight percent of the original 1,454 players.
So, what does this mean?
1. Generally, rookie wideouts have a small impact in the NFL. Of the 1,454 rookie seasons, 33 (2.3%) players had eight TDs or more. Only 25 (1.7%) had 60 or more receptions. Finally, only 12 (0.8%) hit the 1,000-yard mark. For a standard fantasy scoring league, a rookie WR will only average 2.7 pts/g (3.9 pts/g for PPR).
2. Based on the data, an "average" WR should yield 4.5 pts/g in standard leagues (6.8 pts/g for PPR).
3. Based on the data, target a few second-year players in your drafts. Below are a list of some who had solid rookie seasons and should already be on your draft radar:
a. Keenan Allen, San Diego
b. DeAndre Hopkins, Houston
c. Terrance Williams, Dallas
d. Kenny Stills, New Orleans
e. Robert Woods, Buffalo
f. Marlon Brown, Baltimore
g. Aaron Dobson, New England
h. Ace Sanders, Jacksonville
i. Cordarrelle Patterson, Minnesota
j. Kenbrell Thompkins, New England
k. Andre Holmes, Oakland
l. Tavon Austin, St. Louis
m. Justin Hunter, Tennessee
4. Here is a list of sleeper second year players.
a. Marquise Goodwin, Buffalo
b. Griff Whalen, Indianapolis
c. Stedman Bailey, St. Louis
d. Da'Rick Rogers, Indianapolis
e. Jaron Brown, Arizona
f. Josh Boyce, New England
g. Brice Butler, Oakland
h. Eric Page, Tampa Bay
i. Nick Toon, New Orleans
j. Myles White, Green Bay
k. Markus Wheaton, Pittsburgh


