This article is part of our Nerd Alert series.
It's a fact: Chauncey Billups is really good. At real-live basketball, at fantasy basketball -- all of it. And yet a superficial look at his stat line doesn't necessarily reveal this right away. Sure, he's got the 5.4 assists, and that's not bad -- and the 2.1 threes per game, which is quite good -- but his field-goal percentage is so low (just 41.7% for his career) that it's easy, at first blush, to mistake Billups for a decent, but not excellent, player.
Of course, knowledgeable fantasy owners and basketball fans know that the reason for Billups' low FG% is because he takes so many threes -- in fact, 45.3% of Billups' shot attempts are from behind the arc. Smarter fans and owners also know that Billups is a menace (the good kind) from the free-throw line, not only converting at an excellent percentage (92.1% currently, 89.1% career), but also taking a high number of attempts (5.7 currently -- compared to just 10.4 field-goal attempts).
The one thing that's tough to eyeball, however, is the degree to which Billups' free-throw and three-point contributions mitigate the aforementioned low FG%. Fortunately, this is precisely what the stat true-shooting percentage (TS%) does. By finding out a player's points per possession and then putting it on an FG% scale*, TS% allows us to compare all manner of players to each other, regardless of how they get their scoring done.
The precise formula is: PTS / (2 * (FGA + 0.44 * FTA))
By this
It's a fact: Chauncey Billups is really good. At real-live basketball, at fantasy basketball -- all of it. And yet a superficial look at his stat line doesn't necessarily reveal this right away. Sure, he's got the 5.4 assists, and that's not bad -- and the 2.1 threes per game, which is quite good -- but his field-goal percentage is so low (just 41.7% for his career) that it's easy, at first blush, to mistake Billups for a decent, but not excellent, player.
Of course, knowledgeable fantasy owners and basketball fans know that the reason for Billups' low FG% is because he takes so many threes -- in fact, 45.3% of Billups' shot attempts are from behind the arc. Smarter fans and owners also know that Billups is a menace (the good kind) from the free-throw line, not only converting at an excellent percentage (92.1% currently, 89.1% career), but also taking a high number of attempts (5.7 currently -- compared to just 10.4 field-goal attempts).
The one thing that's tough to eyeball, however, is the degree to which Billups' free-throw and three-point contributions mitigate the aforementioned low FG%. Fortunately, this is precisely what the stat true-shooting percentage (TS%) does. By finding out a player's points per possession and then putting it on an FG% scale*, TS% allows us to compare all manner of players to each other, regardless of how they get their scoring done.
The precise formula is: PTS / (2 * (FGA + 0.44 * FTA))
By this measure, Chauncey does well. Like, really well. In fact, of all qualified players, only Nene Hilario (68.9 TS%) and Steve Nash (63.6 TS%) have a higher mark than Billups' 63.5%.
It's not surprising to learn, then, that when we look at the three fantasy category that relate most directly to TS% -- i.e. FG%, FT%, and threes -- we find that Billups also does well by this measure, coming out third (via z-scores, a concept I discussed last week) behind Kevin Durant and Kevin Martin. Noting that Durant (19th among qualified players with a 59.8 TS%) and Martin (9th, 61.1 TS%) also do well by true-shooting percentage, one is led to ask a question: Is it possible to use TS% as a shorthand measure for three (FG%, FT%, 3Pt) of the eight all-important fantasy categories?
The point of this post is to find out -- or, at least, begin to find out.
True-Shooting Percentage and the Three Cats (FG%, FT%, and 3Pt)
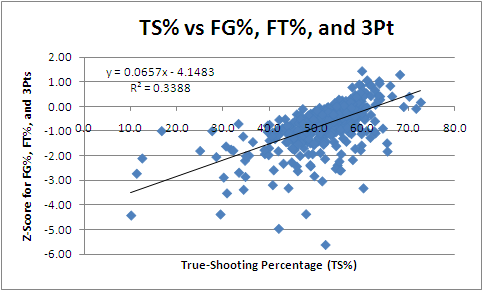
If we plot every player's TS% against the average of his z-scores from the three scoring relevant categories, we get a graph that looks exactly like this:
What does it mean?
Well, for our purposes, two things matters. First, the shape of that slope tells us the relationship between the two is pretty excellent. As TS% increases, so does a player's fantasy standing in the three categories in question.
So, that's good.
Second, the correlation coefficient of .58 tells us about the strength of the relationship between these two variables. Specifically, it tells us that that TS% explains about half a player's fantasy worth in the three cats in question.
That's pretty good, too.
Theoretically, the equation you see there (y = 0.0657x - 4.1483) should project each player's worth in the three relevant cats given only the input of TS%. I put every player's TS% through said equation and found the cases where it missed by the most, so we can learn where our equation is missing.
Here they are:
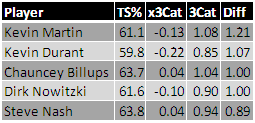
Like I say, these are the cases where our equation missed the most. What do we see?
Well, the first list is the one where our equation most undershot the value of the players. In these cases, the players have a higher fantasy value than TS% alone would predict. What do all these players have in common? Well, mostly, they all shoot free throws really well -- none, in fact, lower than Nowitzki's 87.9%. Also, all of these players shoots the three-ball with some frequency. Nowitzki's average of one three-pointer per game is the lowest of these players. Finally, all these players have true-shooting percentages much higher than their field-goal percentages -- generally, at least 10 or 15 percentage points different.
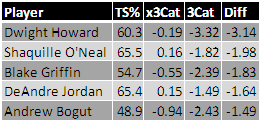
Our second group is one full of players who shoot free throws terribly -- none better than Blake Griffin's 61.4%. Second, none of these players really takes anything like an outside shot. Griffin is the leader of the group with seven three-point makes on the season. Finally, all of these players generally have true-shooting percentages at about the same level as their field-goal percentages -- sometimes, as is the case with Andrew Bogut and DeAndre Jordan, even below their field-goal percentages. This is because of the awful free-throw shooting and lack of threes.
I think the last point in each of the previous paragraphs is the important one here: True-Shooting Percentage might work as a nice shorthand way of targeting players with good production in the three cats, but it's likely that an even better way is to target players who sport a considerable difference in their TS% and FG% -- or what we might call "secondary" shooting skills.
In next week's edition, I'll look at players with strong secondary shooting skills and their respective production in the three cats we're talking about here.