This article is part of our The Z Files series.
Last week, hitters fanning more than expected were discussed. This time around, we'll dissect some batters whiffing less than anticipated. As a reminder, in past seasons I'd write this piece from the point of view that we're at the point in the season when changes in contact rate are predictive. I've come to understand this is a misuse of stability points. The data is backwards-looking, not representative of what will (or should) happen the rest of the season.
Instead, the approach will be looking at the players on an individual basis:
1. Differences in player's plate skills
2. Sustainability
3. Likely effect on production
4. Ancillary outcomes
Something to note before beginning is the extent of the contact rate change is greater for the decliners than those exhibiting improvement. This makes sense since in general, there's more room to fall than gain. It also means by the time we get to the last couple of players discussed, the difference isn't nearly as significant as the last few hitters last week.
- Contact Rate: (At-bats – Strikeouts)/At-bats
- Strikeout rate: Strikeouts/Plate appearances
- BABIP: Batting average on balls in play
- HR/FB: Home runs per fly ball
- FB%: Percentage of fly balls among batted balls
- O-swing%: Percentage of swings on pitches outside the strike zone
- O-contact%: Contact percent of pitches outside the strike zone
- Z-swing%: Percentage of swings on pitches in the strike zone
- Z-contact%: Contact percent of pitches in the strike zone
Data courtesy of
Last week, hitters fanning more than expected were discussed. This time around, we'll dissect some batters whiffing less than anticipated. As a reminder, in past seasons I'd write this piece from the point of view that we're at the point in the season when changes in contact rate are predictive. I've come to understand this is a misuse of stability points. The data is backwards-looking, not representative of what will (or should) happen the rest of the season.
Instead, the approach will be looking at the players on an individual basis:
1. Differences in player's plate skills
2. Sustainability
3. Likely effect on production
4. Ancillary outcomes
Something to note before beginning is the extent of the contact rate change is greater for the decliners than those exhibiting improvement. This makes sense since in general, there's more room to fall than gain. It also means by the time we get to the last couple of players discussed, the difference isn't nearly as significant as the last few hitters last week.
- Contact Rate: (At-bats – Strikeouts)/At-bats
- Strikeout rate: Strikeouts/Plate appearances
- BABIP: Batting average on balls in play
- HR/FB: Home runs per fly ball
- FB%: Percentage of fly balls among batted balls
- O-swing%: Percentage of swings on pitches outside the strike zone
- O-contact%: Contact percent of pitches outside the strike zone
- Z-swing%: Percentage of swings on pitches in the strike zone
- Z-contact%: Contact percent of pitches in the strike zone
Data courtesy of Fangraphs.
Corey Dickerson (Current contract rate 89.5 percent, Projected 74.1 percent)
Dickerson's plate discipline profile is similar to previous seasons with one huge difference, as his Z-contact% is greatly improved. This suggests the change is more about mechanics than approach. Recently, Jeff Sullivan posted this piece on Fangraphs. In it, he notes Dickerson has simplified his stroke by eliminating his high leg kick, sometimes replacing it with a toe tap. Sullivan notes Dickerson still employs the leg kick, just not nearly as much as in previous campaigns. In addition, Sullivan points out Dickerson is choking up a little, as opposed to gripping the knob like he dd previously.
While Dickerson could revert to old mechanics, why would he? The new swing is working; the results are positive. Still, maintaining a Jose Altuve-like contact rate seems like a stretch. It must drop, right? Probably, but keep this in mind. Park factors for strikeouts are real. Last season, Dickerson played half his games in a park inflating strikeouts by nine percent. This year, his home venue reduces them by the same amount. Granted, not everyone is influenced to that exact level, but an expected drop of 18 percent is huge. The point is, even if Dickerson fans more, the baseline expectation should be better than his career numbers. Sustaining a 90 percent contact rate is optimistic, but something in the mid to low 80s seems plausible based on the combination of altered mechanics and park effects.
More contact means a higher batting average, what about his power? Dickerson is pacing for fewer homers than the past few seasons. However, keep in mind the Pirates played much of April with the temperature well below average for that time of the year. Cooler temperatures reduce homers. Four of five of Dickerson's blasts have come since April 26, when the conditions have been more temperate.
Pittsburgh has faced five southpaw pitchers, with Dickerson starting only one of those contests. The last game in which a left-hander took the mound against them was April 25, so we don't know if Dickerson's improvement has earned him full-time play. The club lines up to face lefty Andrew Suarez on Friday, May 29. Dickerson hasn't had an extreme platoon split in the past, including an .849 OPS against LHP this season, albeit in only 16 at-bats. It will be interesting – and telling – if Dickerson is in the lineup.
All told, I'm very bullish on Dickerson and would love to be in on any "sell high" trade discussions.
Alex Gordon (Current 83.3 percent, Projected 71.5 percent)
Gordon being on this list is surprising. The fact that last season his contact rate worsened as the season progressed renders it borderline shocking. One narrative is health. Gordon's 2015 and 2016 were marred by a groin and wrist injury, respectively. However, that doesn't explain the nightmare that was 2017. That said, Gordon has stated he's completely healthy this season, so perhaps there' something to it.
By the numbers, Gordon is swinging less than he did previously, though his already low walk rate had dropped even further. Curiously, Gordon is seeing more overall strikes, but fewer of the first-pitch variety. This could be due to not swinging and missing as much, getting into an 0-1 count.
The major difference in Gordon's profile is an improved O-contact%. His Z-contact% is up a tick but most of the spike in contact is putting non-strikes in play.
Adding to the fog is that Gordon's hard-hit rate is way up, with HR/FB along for the ride. It's not translating into much power as Gordon doesn't appear to be joining the launch angle revolution, preferring to stick with the old Charlie Lau approach – down and hard.
While I'm encouraged, I wish the bulk of the upgrade wasn't an improved O-contact%. Being better at something you shouldn't really be doing isn't a harbinger of sustained success. In deeper leagues, Gordon elevates from an afterthought to an at-bats eater. Hey, we can label a pitcher an innings eater if he contributes volume, why can't we do the same for batters? With so many injuries in today's game, playing time has become as relevant as skills. Gordon may not be a stat-sheet stuffer, but so long as he continues to maintain a batting average circa 2013-2015, which is a reasonable expectation, he's a fantasy asset in deeper formats.
Joc Pederson (Current 80.5 percent, Projected 69.9 percent)
Pederson is interesting from a projection methodology perspective. Let's oversimplify and say a player's performance the past three seasons has been 1, 2, 3 – with 3 the most recent. What should be expected this year? History teaches us it isn't 4, the natural progression. Even in a scenario like this, a weighted average is best, yielding something around 2.4.
Pederson's contact continues to improve, making him an exception. He's swinging at even fewer pitches than past seasons, though the actual contact rate is down a speck from last season.
The problem is, despite fanning fewer times, Pederson isn't taking advantage, either with more power or running more when he's on. Further, he continues to be a platoon player, limiting his plate appearances. His hard-hit rate, while still above average, is falling. Pederson's fly ball rate has dropped precipitously, further capping his power.
As discussed, playing time matters, but until Pederson starts doing more with his, he's only relevant in NL-only formats, even with a career-high batting average.
Tommy Pham (Current 75.8 percent, Projected 65.6 percent)
Let's be fair. Much of Pham's expectation was based on the numbers he posted while dealing with keratoconus. He had career-saving surgery in 2011 and since then has been trying to find the right contact lenses to add the finishing touches to his vision. In 2016, he tried a pair of soft contacts that improved his vision but would shift slightly after running, creating some blur. It's probably not a coincidence he posted an unsightly 40 percent strikeout rate in 183 plate appearances with the Cardinals that season.
That poor contact rate was properly baked into his 2018 expectations. One of the challenges of projections is deciding when to interject subjectivity. After an entire 2017 with a 22 percent strikeout clip, followed by almost a quarter of a season with a mark a couple points lower, I'm willing to reduce the influence of Pham's numbers prior to 2017. I'm still factoring them in as a hedge something goes awry with Pham's vision, but the result is still quite positive.
Pham's current skills sync up with last season, so the same level of production is expected. In 2017, no one, not a single player, amassed 25 homers and 25 steals. Many came close, including Pham who totaled 23 homers with 25 bags. Health permitting – not just his eyes, as he has been battling a groin injury since late April and is still not 100 percent – Pham should make another run at the milestone.
Eugenio Suarez (Current 82.2 percent, Projected 72.7 percent)
It's as if someone told Suarez swinging at fewer balls and more strikes is a good thing. Be it on his own accord or via coaching, that's what he's doing, with the desired results. Granted, Suarez won't sustain a 51 percent hard contact rate, but when it subsides, it should land higher than his career 33 percent mark.
The Reds have already shown indications they recognize the change in Suarez as they moved prized prospect Nick Senzel to second base early in the season. However, they shifted him back to the hot corner when Suarez was out nearly three weeks with a fractured thumb. Suarez is back, but Senzel has been dealing with dizziness, and thus has been out of action since Suarez's return. Cincinnati is likely going to be cautious with Senzel as vertigo cut his 2017 season short. Once Senzel is cleared, it will be interesting to see where he plays for Triple-A Louisville, as Suarez has sparked the Reds lineup since his return.
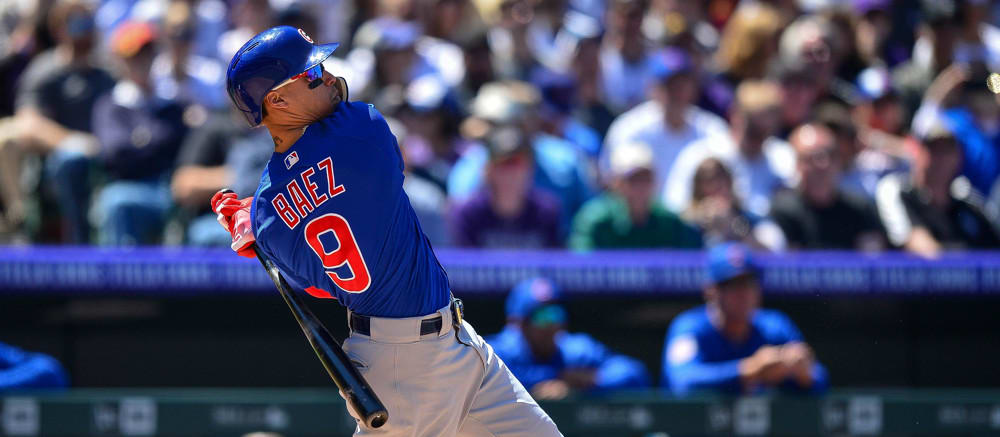
Javier Baez (Current 79 percent, Projected 69.8 percent)
Forget about other scribes. If I had a nickel for every time I wrote, "Imagine if Baez made more contact?"... Thus far, Baez is doing just that, with encouraging results. His batting average is 15-20 points higher than expected, with the potential for more growth. Baez hard-hit rate has increased, so don't even consider the 'sacrificing power for contact' narrative.
Baez has always been a free swinger, and this season is no exception. The good thing is he does most of his swinging at pitches in the zone, rarely taking a strike. His 83 percent Z-Swing mark is near the top of the league among qualified hitters. The catch is 2018's drop in strikeouts emanates from improved O-contact%. Of all the aspects of making contact, this is the least desirable. It'll be tough maintaining an elevated O-contact% in tandem with a higher hard-hit level.
That segues into ancillary analysis with respect to Baez's BABIP. Especially in a small sample, what some consider bad luck isn't fairly classified as such. On the surface, Baez's .293 BABIP is unlucky, based on his hard-hit rate and career .328 mark. While there probably is an element of misfortune, good luck in terms of homers is masquerading as bad luck in BABIP. Granted, what's happened has happened, but an argument can be made a lucky 29 percent HR/FB has bloated Baez's long ball total. If four of his 10 homers were instead doubles, Baez's BABIP would be .337, right in line with previous years.
Baez is making more contact, but I'm skeptical it remains at the current level. In addition, when it falls, some will point to an unlucky BABIP as reason for optimism. I don't see his current BABIP as unlucky. It's an artifact of good luck with regard to HR/FB.
Scott Schebler (Current 84.5 percent, Projected 75.5 percent)
Keeping in mind we're at the bottom portion of the list, the relative difference between current and expected is dwindling, but still worth discussing. Schebler missed time and faces mainly right-handers, so his sample is the smallest analyzed.
The reason I opted to include him is that like Baez, Schebler's improvement is due to better contact when chasing pitches. Admittedly, some hitters are capable of crushing non-strikes as the zone, while not arbitrary, may not represent the sweet spot for all batters. However, big picture, it's better to offer at a strike than a ball. Perhaps Schebler is an exception, but maintaining a high and productive O-swing% seems like dangerous approach.
Schebler's power will climb with the mercury. Just be careful, his contact is likely to slip, dragging average with it.
Joey Gallo (Current 64.5 percent, Projected 56.2 percent)
Gallo is a great example of the difference between contact and strikeout rate. The slugger has walked considerably less than previous seasons. This affects the contact rate (based on at-bats) more than strikeout rate (based on plate appearances). Gallo's strikeout rate is on par with previous seasons, so those looking at that may think status quo. However, an improved contact rate paints a different picture.
Gallo's average doesn't reflect the improved contact as his BABIP and HR/FB are down a little. Remember, homers are hits too, so a drop in long balls lowers average a bit as well.
To be honest, I don't know what to make of Gallo's improved contact. Both his O- and Z-contact% are up. He's swinging a tad more and, like I mentioned, walking considerably less. The farthest I'm willing to go is to say I'm encouraged Gallo isn't fanning even more. I'm not yet ready to contend fewer strikeouts will soon manifest in a higher average. Even adding 20 points would be huge, but I'm just not ready to make that declaration.


