
We made it through another fantasy baseball season. I hope each of you won more than you put forth back in draft season this year. I myself won two leagues, finished second in another, and was all over the place in my remaining leagues, but none more painfully than AL Tout Wars. I was in first or second place from July 1 until the final four days of the season and ended up in fifth place, as four teams jumped me in the final scoring period after a multitude of injuries down the stretch did my roster in. Six teams finished within five points of one another in the final standings, but losing 3.5 points over the final four days is going to haunt me all winter long as a Tout Wars title continues to elude me.
To begin the offseason, I would like to look at how the 2026 season played out statistically as we all plan for what could possibly be a longer offseason than usual. There are some long-established norms for indicators such as a .300 BABIP or a 70 percent stolen base success rate that simply do not match the modern game. I will focus on the post-Covid season numbers, as we now have six full seasons of data to look at since that abbreviated season and the crazy baseball production from 2019 skewed numbers.
Runs Per Game
The addition of the ABS challenge system added additional walks to games (more on that later) but the
We made it through another fantasy baseball season. I hope each of you won more than you put forth back in draft season this year. I myself won two leagues, finished second in another, and was all over the place in my remaining leagues, but none more painfully than AL Tout Wars. I was in first or second place from July 1 until the final four days of the season and ended up in fifth place, as four teams jumped me in the final scoring period after a multitude of injuries down the stretch did my roster in. Six teams finished within five points of one another in the final standings, but losing 3.5 points over the final four days is going to haunt me all winter long as a Tout Wars title continues to elude me.
To begin the offseason, I would like to look at how the 2026 season played out statistically as we all plan for what could possibly be a longer offseason than usual. There are some long-established norms for indicators such as a .300 BABIP or a 70 percent stolen base success rate that simply do not match the modern game. I will focus on the post-Covid season numbers, as we now have six full seasons of data to look at since that abbreviated season and the crazy baseball production from 2019 skewed numbers.
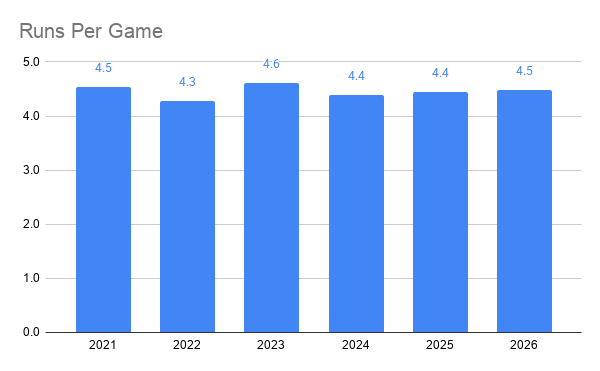
Runs Per Game
The addition of the ABS challenge system added additional walks to games (more on that later) but the amount of offense remained relatively unchanged across the league.
Home Runs
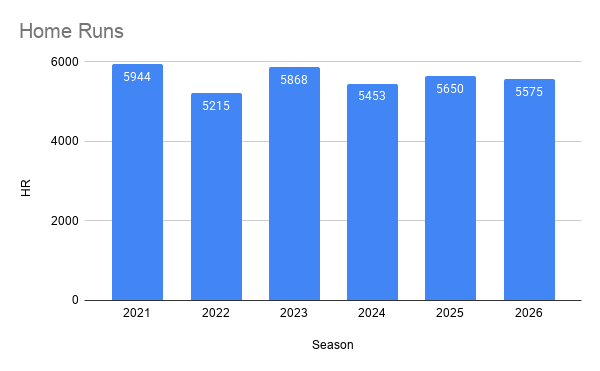
For a while over the summer, it appeared that we might be seeing the return of the 2019 baseball, but things leveled out and home runs finished 75 homers behind their 2025 pace. The days of 6,000 home runs in a season appear to be all but over until we see future league expansion add two teams and dilute the playing pool. Tampa Bay's move from the outdoor situation at Steinbrenner Field back indoors to the renovated Tropicana Field led to eight fewer home runs being hit by the home team and five fewer home runs allowed by the pitching staff in those games. In short, that change does not explain away the reduction in home runs from the 2025 season as much as perhaps the loss of some of the bigger power bats who missed significant time due to injury such as Aaron Judge and Brent Rooker.
Strikeout Rate
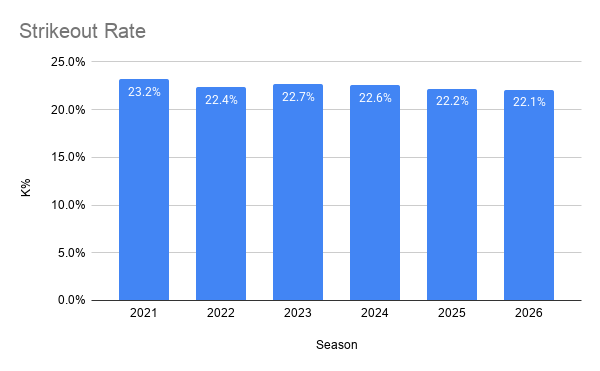
The strikeout rate has now declined each of the past four seasons. It is worth reminding everyone the league-wide strikeout rate never declined in any season from 2005 through 2020 and that the dip from 2021 to 2022 was the first time since 2004 to 2005 that a decline had been observed. This data point likely does not align with your observations, but there was an effort by some teams to increase contact this season, which helped slightly lower the rate from 2025.
Walk Rate
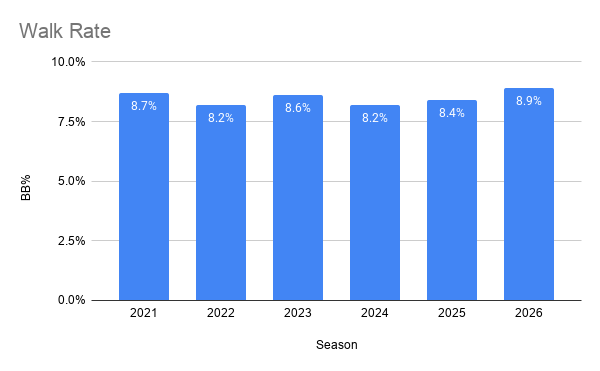
This is where we can see an immediate impact of the ABS challenge system. Outside of the 2020 season, the 8.9 percent walk rate in 2026 was the highest in the league since that same figure from the 2009 season. It is expected the ABS system will continue to evolve and either increase challenges to each team or become more automated so that erroneous calls do not persist once challenges are exhausted. The league did make adjustments in-season, as the early 9.6 percent walk rate from the season's first month eventually stayed below 9.0 percent the rest of the season, but this is likely the new norm.
Batting Average on Balls in Play
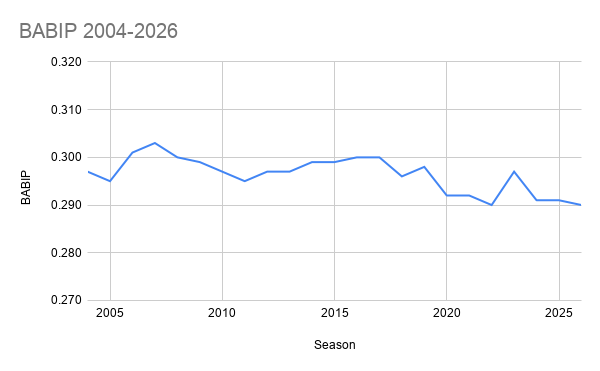
We see slightly more balls in play these days due to the reduction in strikeouts, but outside of a 2023 spike, the old adage of BABIP being somewhere around .300 needs to be adjusted down a bit. The league-wide BABIP has been somwhere between .290 and .292 in five of the past six seasons as the league's attempt to influence the rate with restrictions on defensive shifts has not had the expected impact in this area. Teams reacted by putting premium defenders in the more demanding positions, sacrificing some offense for defense down the lineup.
Batting Average
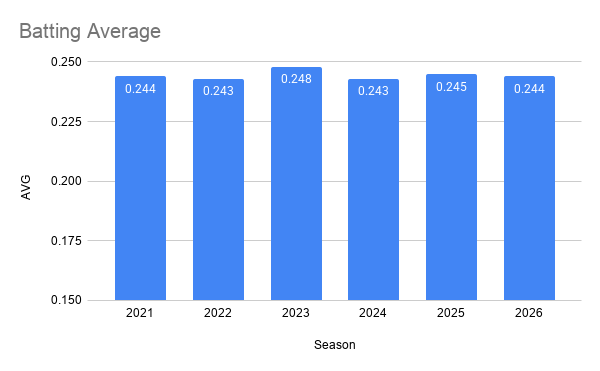
This is clearly the new norm and something we should adjust to if we look at league-wide averages by decade:
- 1970s: .255-.258
- 1980s: .258-.261
- 1990s: .265-.268
- 2000s: .262-.266
- 2010s: .251-.255
- 2020s: .241-.245
Unless baseball decides to put defenders in boxes before a pitch is thrown in order to further limit defensive positioning, this is not changing any time soon. That, combined with ever-increasing velocity, is driving this decline. Where we once were worried about rostering .250 hitters, we now see them in a different light. There were just seven qualified hitters in baseball that hit .300 this season, and we had a catcher, Gabriel Moreno, lead the National League in batting average. A decade ago, there were 25 qualified batters who hit .300, and we peaked in 1996 when 47 such hitters did so.
Steals
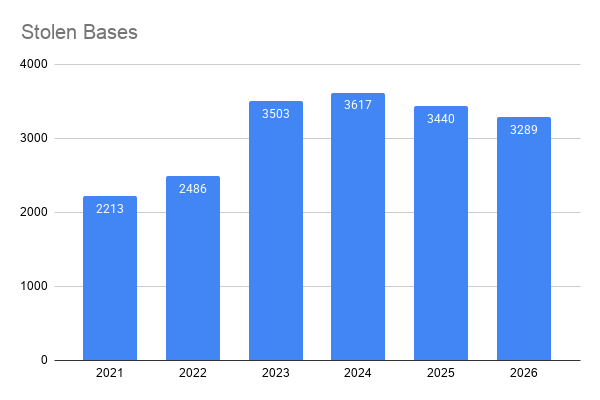
The league always adapts to changes in the game, and stolen bases are no exception. The league-wide total has declined each of the past three seasons. This year, the strategy of throwing further to the right of second base rather than on the bag to prevent steals grew in popularity leading to a drop in steals.
Stolen Base Success Rate
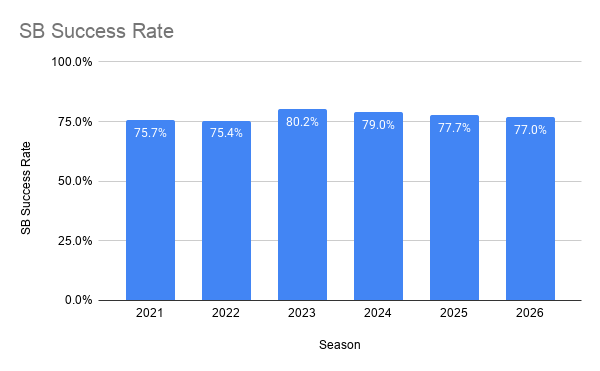
The league struggled to adjust to the new rules in 2023 but has now successfully reduced the stolen base rate in each subsequent season thanks to a combination of better strategy and shortening deliveries home and exchanges to the bases by the catcher. It would not be surprising to see this rate back to 75 percent by the end of the decade.
Saves
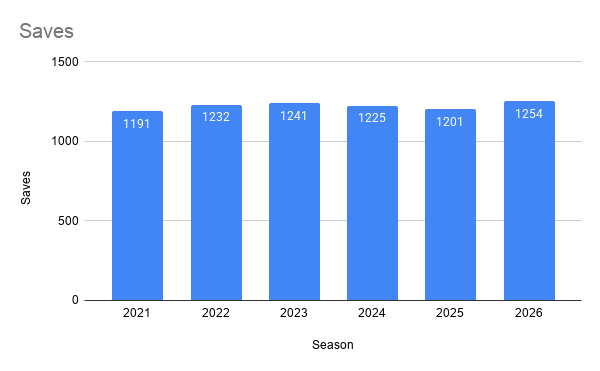
We saw more saves this season than any other season this decade, but we also saw more pitchers in the pool. 257 different pitchers earned a save in 2026, which was 34 more than any other season on the above chart, breaking the previous record of 223 from the 2024 season. We have seen five seasons in league history where at least 200 pitchers have earned a single save in a season, and they have been each of the past five seasons. 15 pitchers had at least 25 saves in 2026, which is consistent with the average this decade but a far cry from the 24 pitchers who did so in 2015 or the 20 who pulled it off in 2016. Bryan Baker and Jacob Latz were league winners this season with their high saves totals from very late ADPs.
ERA
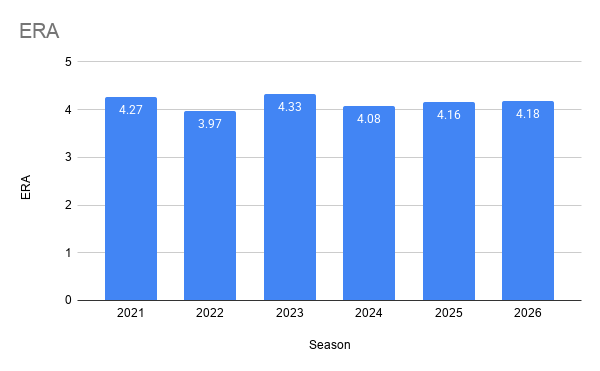
Despite the decline in steals, the league-wide ERA ticked up this season. The extra walks from the first year of the ABS system are likely to blame here more than anything else. The 3.97 league-wide ERA from 2021 is an outlier, as it is the only season since 2016 where the league-wide ERA has been below 4.00. More steals, and for now more walks, almost assure the ERA is not going back under 4.00 in the near future.
WHIP
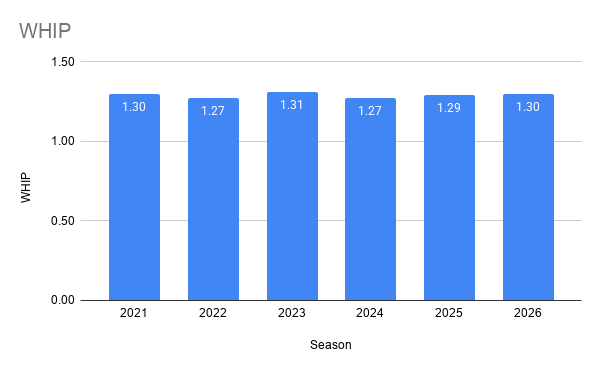
There is nothing surprising here. The extra walks this season pushed the WHIP up slightly, but it was still in line with the average for this decade. We should be looking at pitchers with a 4.00 ERA and a 1.30 WHIP in a different light than we did 10 seasons ago.
Wins
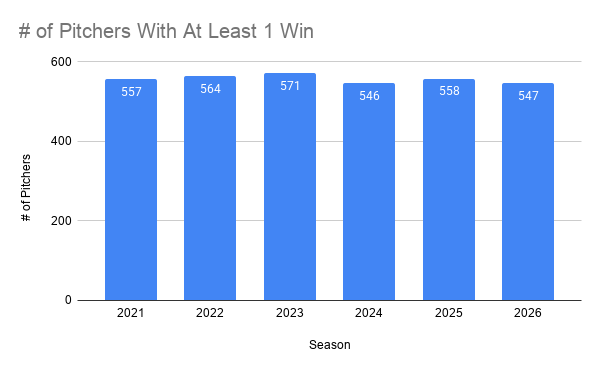
There will always be 2,429 or 2,430 wins in a given season, but the number of pitchers earning those wins continues to remain high. The league saw the fewest number of 10-game winners (53) in a full season since it last expanded in 1998. That broke the previous low of 58 set in 2025. 2022 is the only season this decade where at least 60 pitchers won 10 or more games in a season.
Velocity
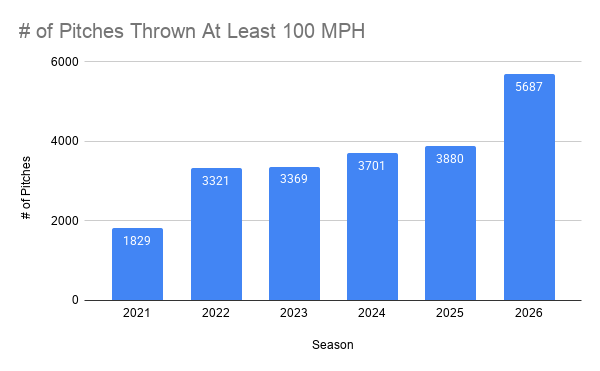
Jacob Misiorowski was responsible for 19.6 percent of these pitches himself and threw more than double of any other pitcher on thie list. 12 other pitchers threw at least 100 pitches at 100 mph or harder, with Mason Miller leading all relievers with 518 such pitches. In all, 98 different pitchers threw at least one pitch at 100 mph. The league hit .179 off those pitches this year, and the frequency of such pitches was already increasing before The Miz announced his presence with authority. Simply put, as long as the velocity increases, the overall offensive numbers will continue to be held in check.
It is my hope this look at the final numbers from 2026 compared to the rest of this decade helps you reframe some long-held axioms in fantasy baseball. The game, for better or for worse, is evolving and the foundations we grew up on in this game are struggling to keep up with this current era of baseball.
