


This article is part of our According to the Data series.
How to Project Passing Stats Based on Game Location (Home vs. Road):
We know teams play better at home because home teams typically see around a three-point spike in the Vegas lines. It follows that skill position players will post better fantasy numbers when they're playing at home as compared to when they're on the road.
But how much different? Are the differences meaningful? If so, do they extend to all positions? Can we translate the data into actionable information to help project players?
I'm not going to touch why home teams play better. In all likelihood, it's a combination of things: no travel, an extra day of game prep, the crowd, help from the referees, whatever. We know an effect exists, so I just want to figure out how we can potentially take advantage of it for fantasy purposes.
In this article, I'll take a look at passing stats.
Passing Stats Based on Game Location
I've done some research that suggests we should typically see a larger deviation in rushing numbers for favorites versus underdogs than we should see for passing stats (in terms of percentages). That's because teams that pass the ball effectively early in games usually get a lead, resulting in fewer second half throws. Meanwhile, teams that don't pass efficiently are forced to throw more late, so the final bulk passing totals tend to "even out" a little bit. We don't see that same effect with rushing totals.
Nonetheless, there's still a pretty significant gap
How to Project Passing Stats Based on Game Location (Home vs. Road):
We know teams play better at home because home teams typically see around a three-point spike in the Vegas lines. It follows that skill position players will post better fantasy numbers when they're playing at home as compared to when they're on the road.
But how much different? Are the differences meaningful? If so, do they extend to all positions? Can we translate the data into actionable information to help project players?
I'm not going to touch why home teams play better. In all likelihood, it's a combination of things: no travel, an extra day of game prep, the crowd, help from the referees, whatever. We know an effect exists, so I just want to figure out how we can potentially take advantage of it for fantasy purposes.
In this article, I'll take a look at passing stats.
Passing Stats Based on Game Location
I've done some research that suggests we should typically see a larger deviation in rushing numbers for favorites versus underdogs than we should see for passing stats (in terms of percentages). That's because teams that pass the ball effectively early in games usually get a lead, resulting in fewer second half throws. Meanwhile, teams that don't pass efficiently are forced to throw more late, so the final bulk passing totals tend to "even out" a little bit. We don't see that same effect with rushing totals.
Nonetheless, there's still a pretty significant gap between home and road passing stats. First, take a look at passing touchdowns.
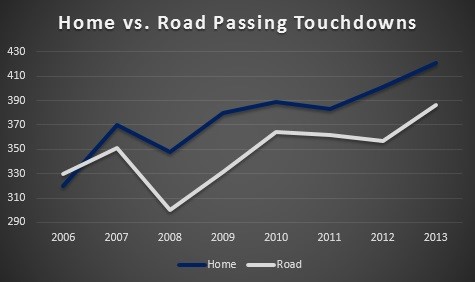
From 2006 to 2013, home teams threw more touchdowns than away teams seven of eight seasons. On average, a quarterback can be expected to throw 8.3 percent more touchdowns at home as compared to on the road. That's a decent gap. For an elite quarterback who throws three touchdowns per game, it's the equivalent of a full fantasy point.
Quarterbacks also seem to make better decisions when at home. As a whole, they've thrown fewer picks than when on the road in each of the past eight seasons.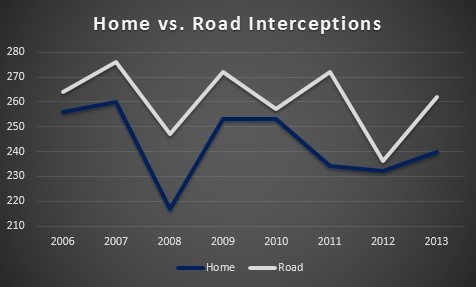
It could also just be due to being forced to attempt low-percentage throws late in games, but whatever the reason, quarterbacks have thrown 7.2 percent more interceptions as visitors - an average of 0.95 at home and 1.02 on the road.
Next, take a look at yards-per-attempt.
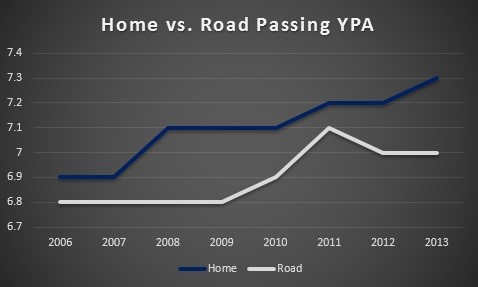
This is a large and obvious deviation, and perhaps more important than the bulk numbers. Whereas bulk stats can be skewed by game situations, YPA won't be, at least not to the same degree. The fact that quarterbacks have been so much worse on the road in terms of passing efficiency suggests we're looking at something real and not just noise.
As mentioned, bulk stats can get skewed by game situations. That's represented in the passing yards graph:
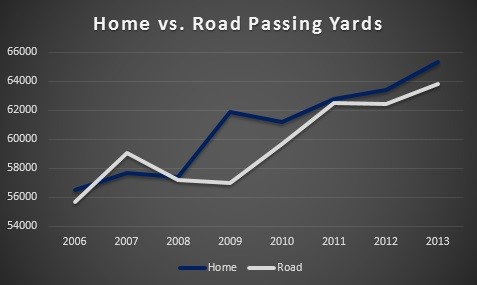
The difference here isn't nearly as pronounced. The average home team has thrown for 237 yards, while the typical away team is just four yards behind at 233. That's basically nothing, and it suggests road teams are making up for reduced passing efficiency with more attempts; throw poorly early in the game, get down, throw a lot late in the game to catch up, and counteract the bad passing with more attempts. Further, when teams get down by more than one touchdown, they often see increased late-game efficiency because defenses play very soft to limit quick scores.
Note that lots of bad passing can help with passing yards, but the same effect isn't there with touchdowns. So the biggest advantage home quarterbacks have over those on the road doesn't come with more attempts or yards, but rather more scores.
Just to be sure, I charted the number of passing and rushing attempts in the NFL from 2006 to 2013.
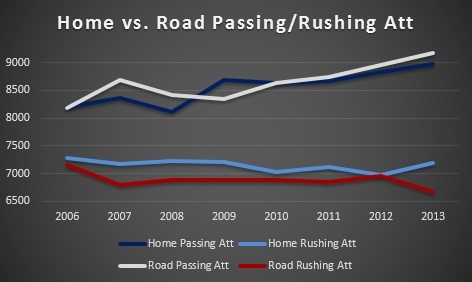
Although home and road passing attempts have been fairly close, the visitors have still aired it out just a bit more - around 80 more times per season, on average. That's more significant when you consider many teams implement a "conservative" early approach on the road, rushing the ball more than normal to begin games.
Home teams have clearly rushed the ball more than away teams overall, though, beating them out in all eight seasons. In the average NFL week, home teams run the ball 15.5 more times than away teams. That's 263 attempts per year - more than three times the gap between home and road passing attempts.
This idea is a big reason that we can almost always brush off stats like "Team X wins 99 percent of the time when they run the ball 25 times." They run the ball because they're winning, not vice versa. Home teams run more because, on average, they win more. They don't win more because they run more.
Jonathan Bales is the author of the Fantasy Football for Smart People book series. He also runs the "Running the Numbers" blog at DallasCowboys.com and writes for the New York Times.


