This article is part of our The Saber's Edge series.
It has been more than a year since StatCast data became available to the general public. While not all data is available for consumption, like defensive positioning, the key data now available is batted-ball velocity. This new data can be used to help with player projections and determine if a player's talent has changed for the good or bad. The following is an examination of some of the most current StatCast studies and how they can be used to help your fantasy team.
One key point to understand with the new batted-ball data is that what we see on TV isn't available to everyone. Some extreme batted-ball data is missing, like a high pop-up, groundball in front of the plate and line drive down the lines. The StatCast data reminds of the early years of Pitchf/x data where data was misclassified, pitches had basic classifications (just fastball, as opposed to cutter, four-seam, two-seam or sinker) or were completely missing. Five or so years from now, I expect us to look back at this data and laugh at how we could ever work with it, but that is not going to stop people from being on the cutting edge. Truthfully, I don't expect some of the current findings to change much, but I could see some changes on the periphery where 100 mph is now hard hit, but the number, for example, should be 95 mph.
With the preceding reasons to suspect some data inconsistencies, two recent studies, one pitcher
It has been more than a year since StatCast data became available to the general public. While not all data is available for consumption, like defensive positioning, the key data now available is batted-ball velocity. This new data can be used to help with player projections and determine if a player's talent has changed for the good or bad. The following is an examination of some of the most current StatCast studies and how they can be used to help your fantasy team.
One key point to understand with the new batted-ball data is that what we see on TV isn't available to everyone. Some extreme batted-ball data is missing, like a high pop-up, groundball in front of the plate and line drive down the lines. The StatCast data reminds of the early years of Pitchf/x data where data was misclassified, pitches had basic classifications (just fastball, as opposed to cutter, four-seam, two-seam or sinker) or were completely missing. Five or so years from now, I expect us to look back at this data and laugh at how we could ever work with it, but that is not going to stop people from being on the cutting edge. Truthfully, I don't expect some of the current findings to change much, but I could see some changes on the periphery where 100 mph is now hard hit, but the number, for example, should be 95 mph.
With the preceding reasons to suspect some data inconsistencies, two recent studies, one pitcher related and one for hitters, used StatCast. The first is written by William Sapolsky at the Hardball Times. While readers may not be familiar with the young Mr. Sapolsky, they may be with his high school teacher, Jared Cross, who created the Steamer projections system. The main conclusions from the study are found here:
"We found that for each mph of exit velocity a hitter is above league average, we can expect him to put up eight additional points of wOBA the next season, which is pretty big. This tells us that players with higher exit velocities are, in fact, hitting better overall. But we also wanted to know if they were outperforming their projections, so we ran a similar regression but included Steamer projections as a variable."When used in conjunction with Steamer, the impact of exit velocity was still significant, both statistically and practically. We can expect a hitter to outperform his Steamer projected wOBA by roughly three points for each mph of previous-season exit velocity. (We found a similar effect when using either ZiPS projections or an average of ZiPS and Steamer.)"
Of the two paragraphs, the second is the important one to keep in mind. The first helps to make a player's projection for the next season, and preseason projections are fairly accurate at this point, so not a huge gain with it. The second paragraph looks at in-season data. It mentions that whether a player's projected wOBA (a complete measure of a player's talent) will be higher or lower than expected depends on batted-ball data.
An example of a player changing is Victor Martinez. He dealt with injuries last year, and his ISO dropped from a 2014 value of .230 to .120 in 2015. This season, his average batted-ball velocity has jumped from an average of 88 mph to 92.2 mph and his ISO to .190. It is nice to see the increase in batted-ball data to go with the increase in production.
The key area I see StatCast being used in-season is to determine if a player is injured. One can go to the StatCast Leaderboard, hover over a player's name and then cut-and-paste the player's data. Here is VMart's average velocity when looking at his last 40 batted balls.
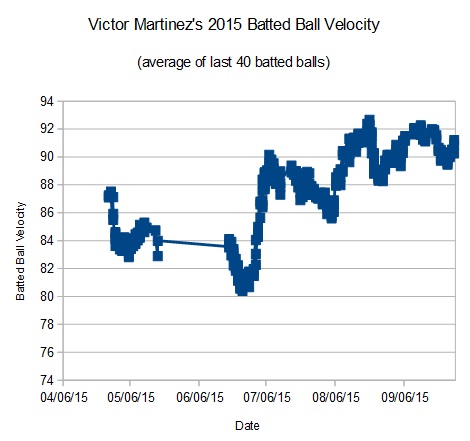
Since 2015 was the first season with public batted-ball data, we don't know where Martinez was in 2014. We do know that the league average is 92.5 mph for 2015, so he started the season below average and then went on the disabled list. He came back with limited production and then saw his exit velocity increase, finishing the season near the 92 mph he has posted this season.
Well, that is it for hitters, and the next big study that came out was written by Russell Carleton at Baseball Prospectus. He looked at when the batted-ball velocity from pitchers stabilized. He first found this:
"At 40-something balls in play, we can get an average exit velocity for a hitter that is fairly reliable. To put that in some context, the batting stats that have the lowest point of reliability are things like swing rate and strikeout rate, which become reliable around 50 or 60 PA. Exit velocity requires a ball in play, so 40 balls in play might take a few more PAs, but the point where it's "not a small sample size anymore" is very quick to come in the season."
The exit velocity for pitchers takes just a relatively few balls in play to stabilize. For a starter, this can be just two or three games. But then the next finding was even more remarkable:
"As you add more data to the sampling frame, reliability of exit velocity doesn't get better for pitchers. It actually starts trending ... downward. More data makes for a less reliable estimate of true talent. When I saw this, I looked at what happened to the batter's as you add more data, and found a more traditional expectation that reliability went up and up and up with more data. What's going on with pitchers? ..."I'd suggest that we're seeing something similar for pitchers and the time that it takes for that true talent to wander around is a lot less than you might think. We know that pitchers do get better and worse as they develop and age, but maybe those developments are less linear and more rapid than we thought. It is possible -- and according to these numbers, common! -- that while a pitcher might have had a good April, by June he could be a different pitcher. What's strange is that we're not seeing that these numbers are unreliable. In that case, we might say that exit velocity allowed is all chance, sorta like BABIP. In fact, in small doses, exit velocity is quite reliable."
It seems that the last 50 balls in play give a good idea of a pitcher's talent level on batted-ball velocity. Anything more than that and the pitcher data becomes less reliable.
This type of thinking is new but is intuitive. In a recent Hardball Times article I wrote, I found pitchers are constantly changing their velocity and batted-ball allowed mix (more or fewer groundballs). I found only 7 percent of all pitchers maintain their groundball rate and velocity from one season to the next. The key is to look at a pitcher's most recent performance.
To get this recent performance, head back to Baseball Savant's search like this one for Matt Harvey and download the .csv. Looking at his 2015 data, his average exit velocity on fastballs less than 94 mph was 93.3 mph. For his fastball between 96 and 97 mph, the average exit velocity was 91.2 mph. With his 2 mph drop in fastball velocity this season, it's easy to see why he is getting hit harder with his BABIP (.272 to .385) and HR/9 (.86 to .93) both up. The key for Harvey now is adapt to the lower velocity by changing his pitch mix or using a 2-seam vs. 4-seam fastball.
I think there are many changes coming with the addition of StatCast data. Even while working on this article, I found a possible way to predict a how a pitcher will age. I will have to run quite a few more numbers to be sure, but there are quite a few possibilities for future studies. For now, enjoy the limited advancements with the new data and incorporate them into your fantasy analysis.