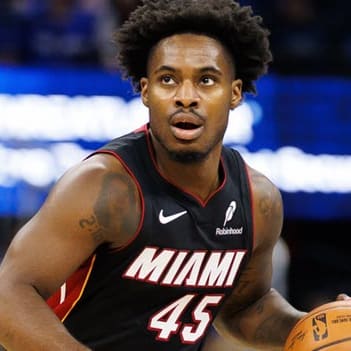
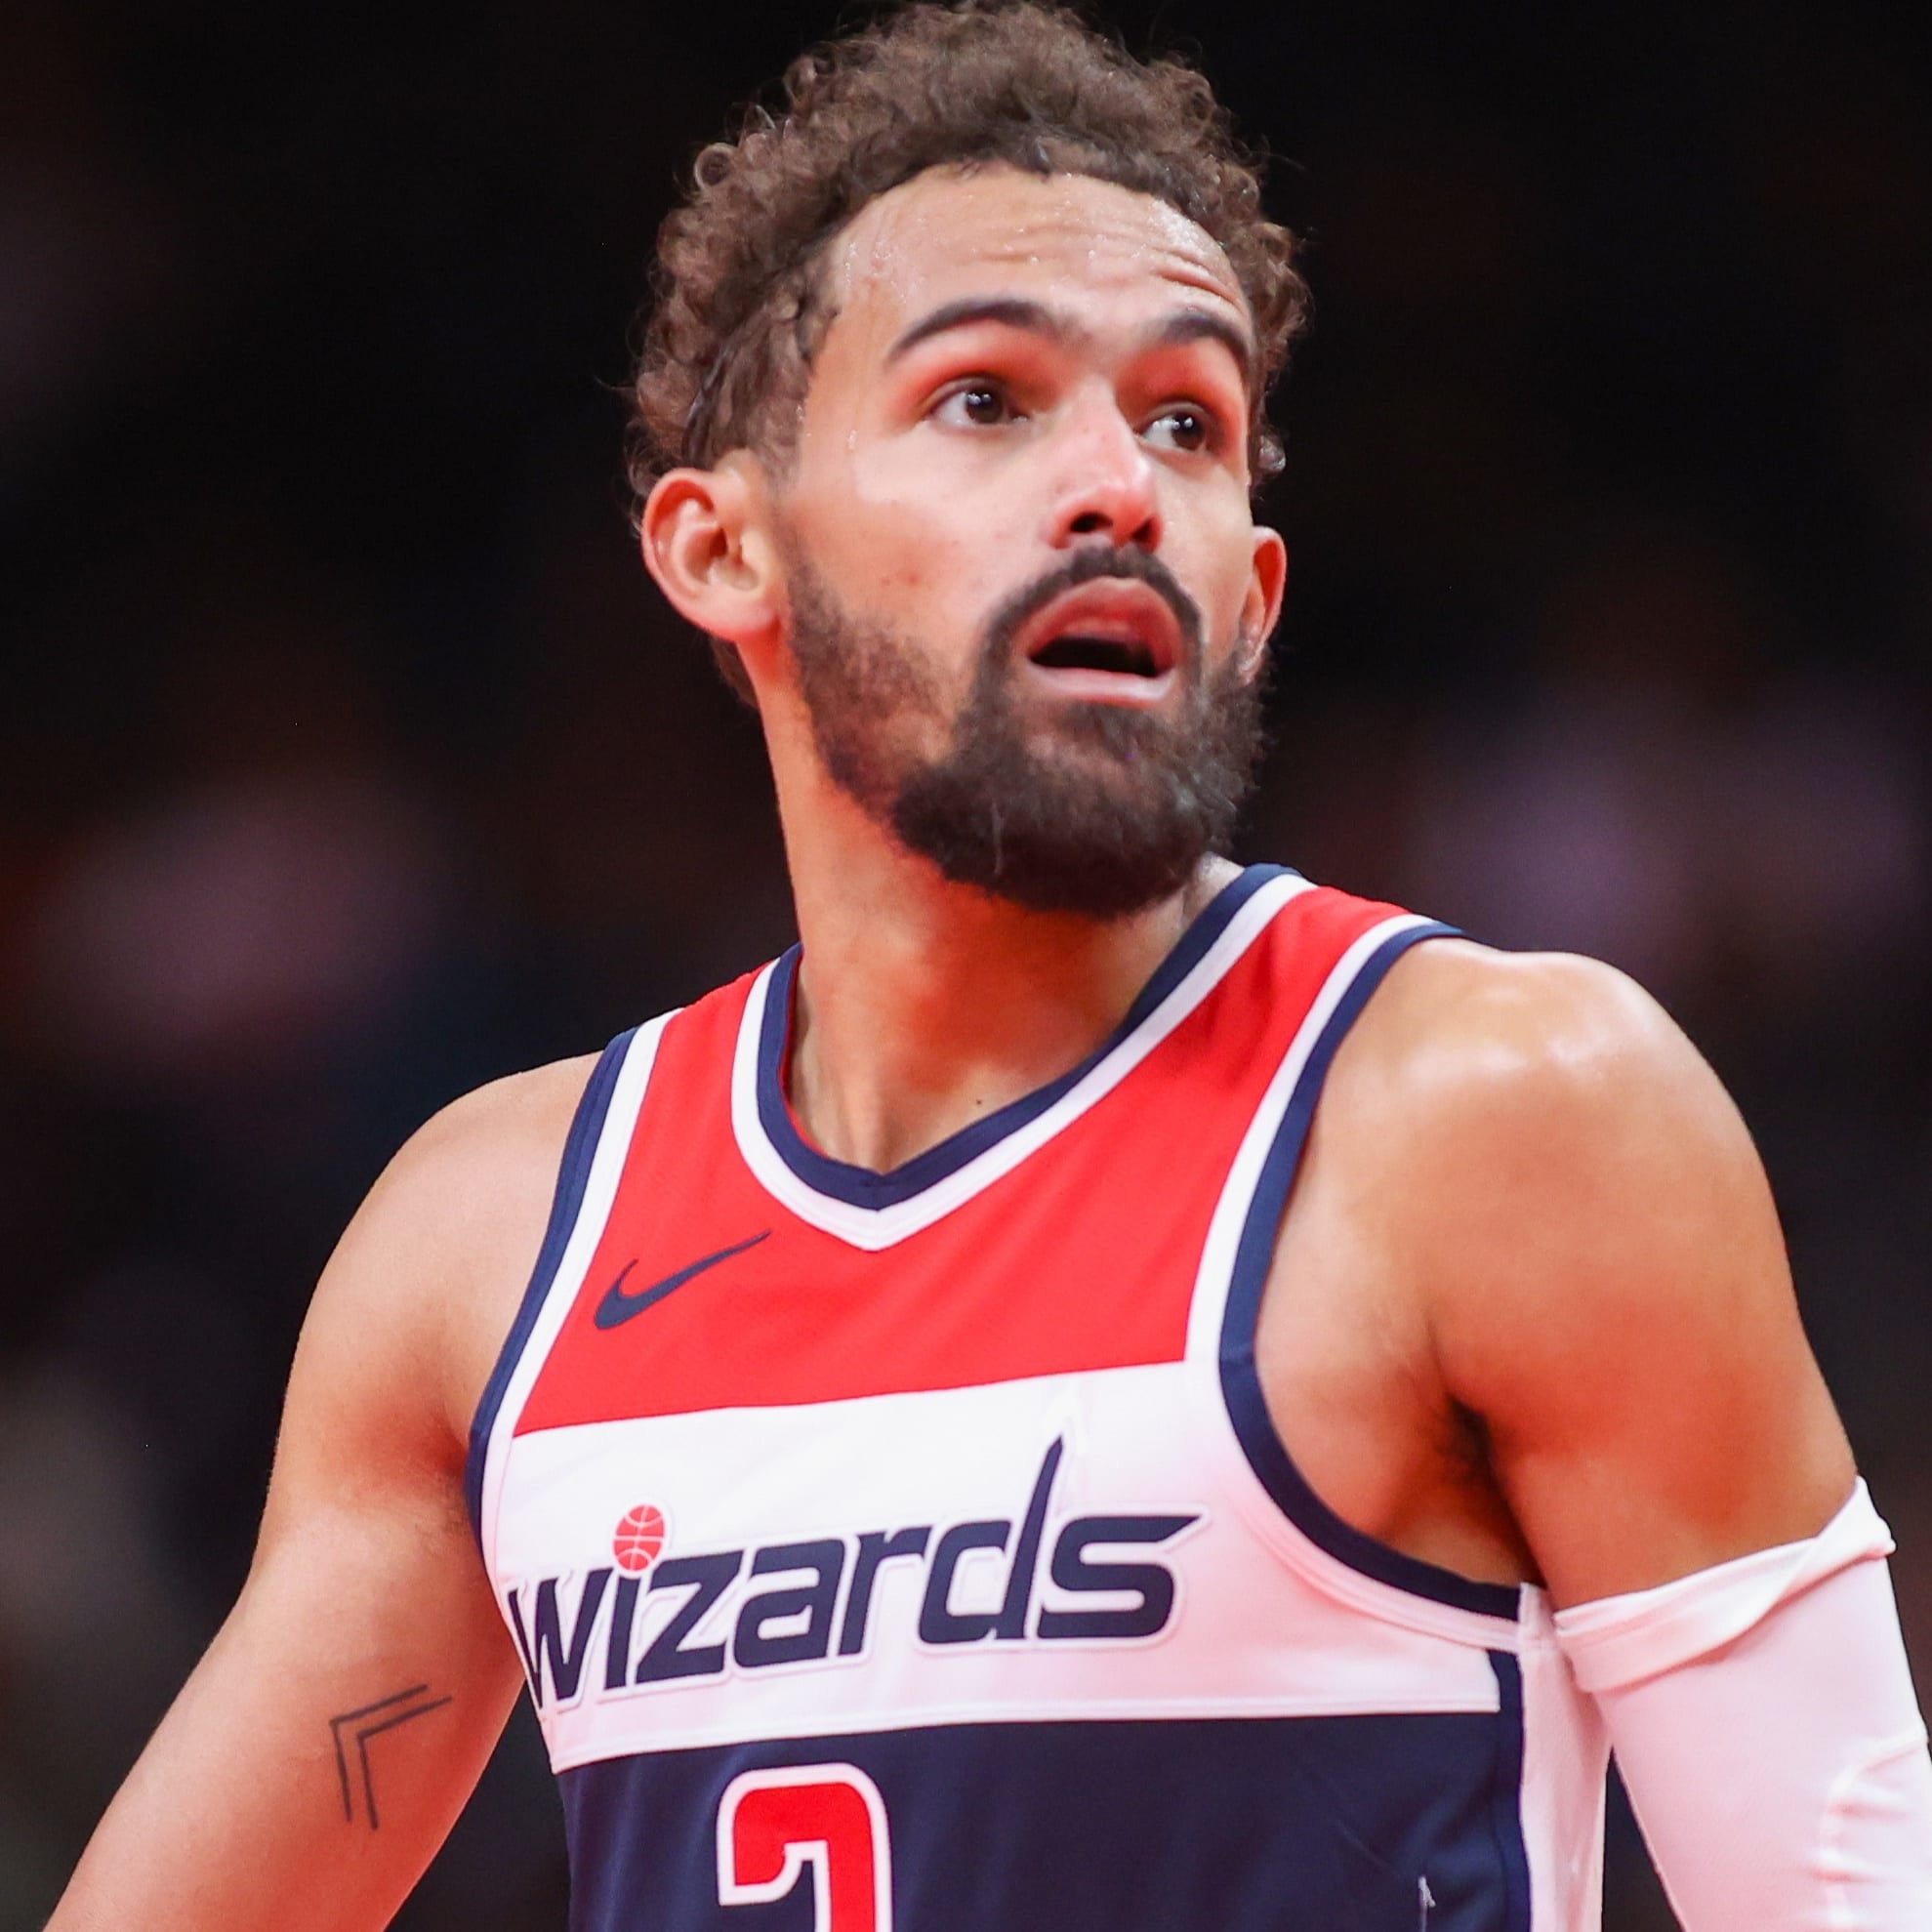
Do NBA Players Play Better in Contract Years?
No. We tracked 448 NBA contract-year seasons across 11 free-agent classes (2015 to 2025), and the average player posted a PER 0.25 lower than the year before. Against similar players who were not on expiring deals, the gap was 0.21 lower. Only 42% of contract-year players improved their PER, compared with 49% of similar players.
The popular idea is that a player with a payday coming pushes harder, takes more shots and produces more. The numbers say otherwise. Points, minutes, usage and assists all slipped slightly in contract years, and efficiency barely moved. Here is the full study, the biggest bumps and busts, and what it means for the 2027 NBA free agents who are in a contract year right now.

NBA Contract Year Bump: The Key Findings
• PER: −0.25 vs. the prior season (−0.21 vs. similar players), n=448.
• Who improved: 42% of contract-year players raised their PER, vs. 49% of similar non-expiring players.
• Big jumps are rarer: 8.5% gained 3+ PER, vs. 12.0% of similar players. About 10.7% lost 3+ PER, vs. 10.3%.
• Role did not grow: Minutes (−0.47 per game), points (−0.32) and usage (−0.46 points) all slipped.
• The year after signing: PER fell another 0.30 (n=381), though part of that is ordinary regression after a strong season.
| Stat (change vs. prior year) | Contract-year change | Vs. similar players | Read |
|---|---|---|---|
| PER | −0.25 | −0.21 | Slightly down |
| Points per game | −0.32 | −0.32 | Slightly down |
| Minutes per game | −0.47 | −0.30 | Flat |
| Usage % | −0.46 | −0.37 | Slightly down |
| Assists per game | −0.06 | −0.12 | Slightly down |
| Rebounds per game | −0.09 | −0.08 | Flat |
| 3-pointers made | +0.05 | −0.01 | Flat |
| Steals per game | −0.02 | −0.02 | Flat |
| Blocks per game | −0.02 | −0.01 | Flat |
| FG% (points) | +0.08 | +0.04 | Flat |
| True shooting % (points) | +0.43 | +0.16 | Flat |
| Games played | −0.90 | +0.48 | Flat |
"Similar players" are non-expiring players of the same age band and prior-year PER tier. "Slightly down" means the controlled change is at least two standard errors below zero.
How We Measured the NBA Contract Year Effect
Contract-year studies tend to go wrong in two places: who counts as a contract-year player, and what they are compared against. Here is how we handled both.
• Contract year: the final season before a player signed as a free agent, from Spotrac's free-agent classes for 2015 through 2025 (1,468 signings, covering contract years from 2014-15 through 2024-25).
• Qualifying seasons: at least 40 games and 20 minutes per game in both the contract year and the prior year. That left 448 contract-year seasons with a usable prior year (586 qualified in the contract year alone, and 381 also qualified the following year).
• Metrics: PER and usage from Basketball-Reference's advanced tables, plus per-game points, rebounds, assists, steals, blocks, three-pointers made, field-goal percentage, true shooting and games played.
• Comparison group: 1,345 non-free-agent player-seasons, matched on age band (24 and under, 25-27, 28-30, 31+) and prior-year PER tier (under 13, 13-16, 16-20, 20+). This matters because players naturally rise and fall with age and ability, and high performers regress toward the average.
Limits. The sample only includes players who signed as free agents. Players who retired or went unsigned, and players who signed extensions before free agency, are not in it. 63 of the 1,468 signings could not be matched to a Basketball-Reference season, mostly players who had not yet played in the NBA. These are averages, and they describe what happened without proving why.
More hoops data from RotoWire: Every NBA team's October record since 2016-17: win rates, ATS results, opening-night marks and the toughest 2026-27 October schedules.
The Contract-Year Bump Has Faded Since 2018-19
Early in the sample, contract-year players looked slightly better than similar players. The more recent classes tell a different story.
| Contract-year season | Free-agent class | PER change vs. similar | Players (n) |
|---|---|---|---|
| 2014-15 | 2015 | +0.49 | 54 |
| 2015-16 | 2016 | −0.24 | 49 |
| 2016-17 | 2017 | +0.36 | 43 |
| 2017-18 | 2018 | +0.22 | 38 |
| 2018-19 | 2019 | −0.55 | 57 |
| 2019-20 | 2020 | −0.16 | 43 |
| 2020-21 | 2021 | −0.40 | 45 |
| 2021-22 | 2022 | −0.68 | 22 |
| 2022-23 | 2023 | −0.87 | 35 |
| 2023-24 | 2024 | −0.71 | 34 |
| 2024-25 | 2025 | −0.23 | 28 |
Contract years from 2014-15 through 2017-18 averaged +0.21 PER vs. similar players (n=184). Seasons from 2018-19 through 2024-25 averaged −0.50 (n=264), with every class below zero. We picked that split after looking at the data, so treat it as descriptive rather than a tested finding.
Does the bump show up in any age or ability group?
| Group | PER change vs. similar | Players (n) | Read |
|---|---|---|---|
| Age 24 and under | −0.33 | 74 | Flat |
| Age 25-27 | −0.41 | 117 | Flat |
| Age 28-30 | −0.27 | 129 | Flat |
| Age 31 and older | +0.10 | 128 | Flat |
| Prior-year PER under 13 | −0.31 | 144 | Flat |
| Prior-year PER 13-16 | +0.08 | 137 | Flat |
| Prior-year PER 16-20 | −0.32 | 108 | Flat |
| Prior-year PER 20+ | −0.44 | 59 | Flat |
No group shows a bump, and none of these group-level changes is statistically distinguishable from zero. The closest thing to a gain is players 31 and older at +0.10 PER.
Biggest NBA Contract-Year Bumps and Busts
Averages hide individual stories. These are the largest PER swings from the prior season to the contract year among qualifying players. PER values are Basketball-Reference figures, and ties share a rank.
Biggest contract-year bumps
| Rank | Player | Season | Team | Age | Prior PER | Contract PER | Change |
|---|---|---|---|---|---|---|---|
| 1 | 2014-15 | CHI | 25 | 13.5 | 21.3 | +7.8 | |
| 2 | 2024-25 | 2 teams | 24 | 8.9 | 15.9 | +7.0 | |
| 3 | 2016-17 | UTA | 30 | 13.2 | 19.3 | +6.1 | |
| T-4 | Nikola Vučević | 2018-19 | ORL | 28 | 19.7 | 25.5 | +5.8 |
| T-4 | 2021-22 | MIA | 36 | 5.5 | 11.3 | +5.8 | |
| 6 | Lou Williams | 2014-15 | TOR | 28 | 14.2 | 19.9 | +5.7 |
| 7 | 2019-20 | NOP | 22 | 13.4 | 18.8 | +5.4 | |
| 8 | 2020-21 | MIL | 25 | 14.6 | 19.9 | +5.3 | |
| T-9 | Marvin Williams | 2015-16 | CHA | 29 | 11.8 | 16.9 | +5.1 |
| T-9 | Dion Waiters | 2016-17 | MIA | 25 | 9.4 | 14.5 | +5.1 |
| T-9 | 2020-21 | UTA | 33 | 14.1 | 19.2 | +5.1 |
Biggest contract-year busts
| Rank | Player | Season | Team | Age | Prior PER | Contract PER | Change |
|---|---|---|---|---|---|---|---|
| 1 | 2015-16 | 2 teams | 28 | 18.5 | 9.7 | −8.8 | |
| 2 | 2014-15 | CLE | 26 | 26.9 | 18.8 | −8.1 | |
| 3 | 2016-17 | GSW | 28 | 31.5 | 24.6 | −6.9 | |
| 4 | 2022-23 | 2 teams | 34 | 19.6 | 13.1 | −6.5 | |
| T-5 | 2022-23 | 2 teams | 34 | 14.8 | 8.9 | −5.9 | |
| T-5 | 2021-22 | UTA | 34 | 15.9 | 10.0 | −5.9 | |
| 7 | Arron Afflalo | 2014-15 | 2 teams | 29 | 16.0 | 10.7 | −5.3 |
| 8 | 2021-22 | WAS | 28 | 22.7 | 17.5 | −5.2 | |
| T-9 | 2019-20 | TOR | 35 | 16.7 | 11.8 | −4.9 | |
| T-9 | Austin Rivers | 2018-19 | 2 teams | 26 | 12.6 | 7.7 | −4.9 |
Both lists are full of regression to the mean. Players coming off unusually good or bad seasons tend to move back toward their normal level, which is why a contract year can look like a leap or a collapse without any change in effort. Jimmy Butler's 2014-15 season is the largest jump in the sample.
Also from RotoWire: A family of four pays $343 on average to attend an NBA game in 2026-27, from $168 in New Orleans to $1,277 at Knicks games. See all 30 teams.
What Happens After NBA Players Sign Their Contracts?
Among the 381 players who also qualified in the first season after signing, PER fell another 0.30 on average (0.22 vs. similar players), and 42% improved. Minutes and scoring were basically unchanged, while usage slipped slightly (−0.27 points) and shooting efficiency held flat. Because teams pay for strong seasons, some of that is regression, not a post-payday slump.
2027 NBA Free Agents: Who Is in a Contract Year in 2026-27?
Spotrac lists 254 players in the 2027 NBA free-agent class, and 238 of them have 2025-26 stats on Basketball-Reference. After the same 40-game, 20-minute filter used in the study, 116 remain: 45 on true expiring deals (32 unrestricted, 13 restricted), 22 with player options, 48 with club options and 1 with a mutual option. The league has changed a lot this offseason, so check each player's current team and contract status before the season starts.
Expiring deals worth watching
These players are on the final year of their contracts and were productive last season. The table shows their 2025-26 line, and teams are the 2025-26 team listed on Basketball-Reference.
| Player | Age | 2025-26 team | Type | PER | PPG | Usage % |
|---|---|---|---|---|---|---|
| Marvin Bagley III | 28 | 2 teams | UFA | 20.2 | 10.5 | 18.6 |
| Michael Porter Jr. | 29 | BRK | RFA | 19.9 | 24.2 | 30.5 |
| Deandre Ayton | 29 | LAL | UFA | 18.2 | 12.5 | 16.7 |
| DeMar DeRozan | 38 | SAC | UFA | 17.8 | 18.4 | 22.8 |
| Nikola Vučević | 36 | 2 teams | UFA | 17.7 | 15.1 | 21.4 |
| Keldon Johnson | 28 | SAS | UFA | 17.3 | 13.2 | 21.0 |
| R.J. Barrett | 27 | TOR | UFA | 17.0 | 19.3 | 25.8 |
| Brandon Miller | 24 | CHO | RFA | 16.8 | 20.2 | 28.1 |
| Miles Bridges | 29 | CHO | UFA | 16.0 | 17.1 | 22.3 |
| C.J. McCollum | 36 | 2 teams | UFA | 15.9 | 18.7 | 25.7 |
Stars with player options
A player option means the player decides in the summer of 2027 whether to opt in or become a free agent, so the 2026-27 season is a contract year only in that sense. Last season's qualifying leaders in this group are Nikola Jokić (PER 32.3), Karl-Anthony Towns (22.0), Kevin Durant (21.1), LeBron James (20.8), Julius Randle (18.4), Rudy Gobert (17.5) and Jrue Holiday (16.4). Their decisions will depend on a lot more than one season of production.
Injury-limited wild cards
Several of the biggest names in the class did not reach 40 games last season, so they fall outside the study's filter and their baselines are noisier.
| Player | Type | Games (2025-26) | Minutes per game | PER | Age |
|---|---|---|---|---|---|
| Giannis Antetokounmpo | PO | 36 | 28.9 | 32.6 | 32 |
| Jimmy Butler | UFA | 38 | 31.1 | 23.5 | 38 |
| Anthony Davis | PO | 20 | 31.3 | 21.5 | 34 |
| Kristaps Porziņģis | PO | 32 | 24.0 | 19.6 | 32 |
| Tyler Herro | UFA | 33 | 31.3 | 17.1 | 27 |
| Zach LaVine | UFA | 39 | 31.4 | 14.7 | 32 |
Kyrie Irving (player option), Fred VanVleet and Damian Lillard (player option) did not appear in Basketball-Reference's 2025-26 tables at all, so there is no recent baseline to compare.
What the contract-year study says about this class
The data gives no reason to expect a bump from any of these players. Contract-year players slipped slightly against similar players in every age band except 31 and older, where the change was a statistically flat +0.10. Players who came in with a PER of 20 or higher averaged −0.44 vs. similar players, though that group is small (n=59) and the gap is not statistically significant.
The typical year-to-year spread is wide, with a standard deviation of about 2.3 PER. About 8.5% of contract-year players jumped 3 or more PER, and about 10.7% fell by that much. The reasonable expectation for any player on this list is a season close to last year's, with real uncertainty in both directions. Any individual "breakout" or "decline" call is a guess the data does not support.
NBA Contract Year FAQ
What is a contract year in the NBA?
A contract year is the final season of a player's current contract, after which he becomes a free agent (or decides whether to opt out). In this study it means the last season before a player signed as a free agent.
Do NBA players play better in contract years?
Not on average. From 2014-15 through 2024-25, contract-year players posted a PER 0.25 lower than the year before, and 0.21 lower than similar players on non-expiring deals. Only 42% improved.
Does performance drop after an NBA player signs a big contract?
Slightly. PER fell another 0.30 in the first season after signing (n=381), though regression after a strong season explains part of it. Minutes and scoring were nearly unchanged.
Who are the best 2027 NBA free agents?
Last season's most productive players in the class include Nikola Jokić, Karl-Anthony Towns, Kevin Durant and LeBron James (all with player options), plus expiring-contract names such as Michael Porter Jr., Deandre Ayton, DeMar DeRozan and R.J. Barrett. Giannis Antetokounmpo and Jimmy Butler are also in the class but missed significant time last year.
Which NBA stars have player options in 2027?
Per Spotrac, they include Nikola Jokić, Karl-Anthony Towns, Kevin Durant, LeBron James, Giannis Antetokounmpo, Anthony Davis, Julius Randle, Rudy Gobert and Jrue Holiday. A player option lets the player choose whether to stay or hit free agency in 2027.
Methodology and Data Sources
Free-agent classes for 2015 through 2025 and the 2027 class come from Spotrac. PER, usage, true shooting and per-game statistics come from Basketball-Reference season tables for 2013-14 through 2025-26. Players were matched by name, with manual fixes where the two sources spell a name differently, and matched to Basketball-Reference's player IDs for every comparison season. Players traded mid-season use their combined season totals. The comparison group excludes every player who signed as a free agent that offseason. Figures are averages and describe what happened without establishing cause. Data as of October 15, 2026.