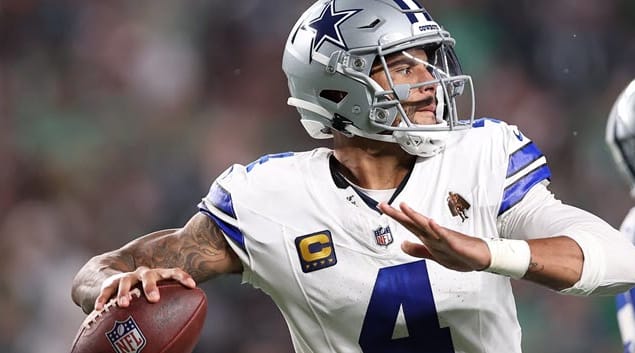
RotoWire ran every Week 5 NFL matchup through an AI simulation model to generate score predictions for the full 16-game slate. Each game was simulated 10 times using a margin-of-victory (MOV) input for both teams, producing a win count and an average MOV for the winning side.
Per RotoWire: the result is a complete set of Week 5 NFL predictions, from a true coin flip to a projected rout.
Read on for the entire projection.

Strongest NFL Week 5 Picks: Chargers, Seahawks and Three 7-of-10 Favorites
The  Los Angeles Chargers have the most one-sided NFL Week 5 prediction on the board, beating the Denver Broncos in 9 of 10 simulations. Their average winning margin was 7.6 points, while Denver's was 6.0 in the one game it took. This simualtion should be welcome news to Chargers fans, who sit at 0-4 amid calls for Mike McDaniels' job as offensive coordinator.
The Seattle Seahawks were next, winning 8 of 10 against the San Francisco 49ers. Seattle's wins averaged 10.0 points, compared with 6.0 for San Francisco, one of the wider gaps on the slate.
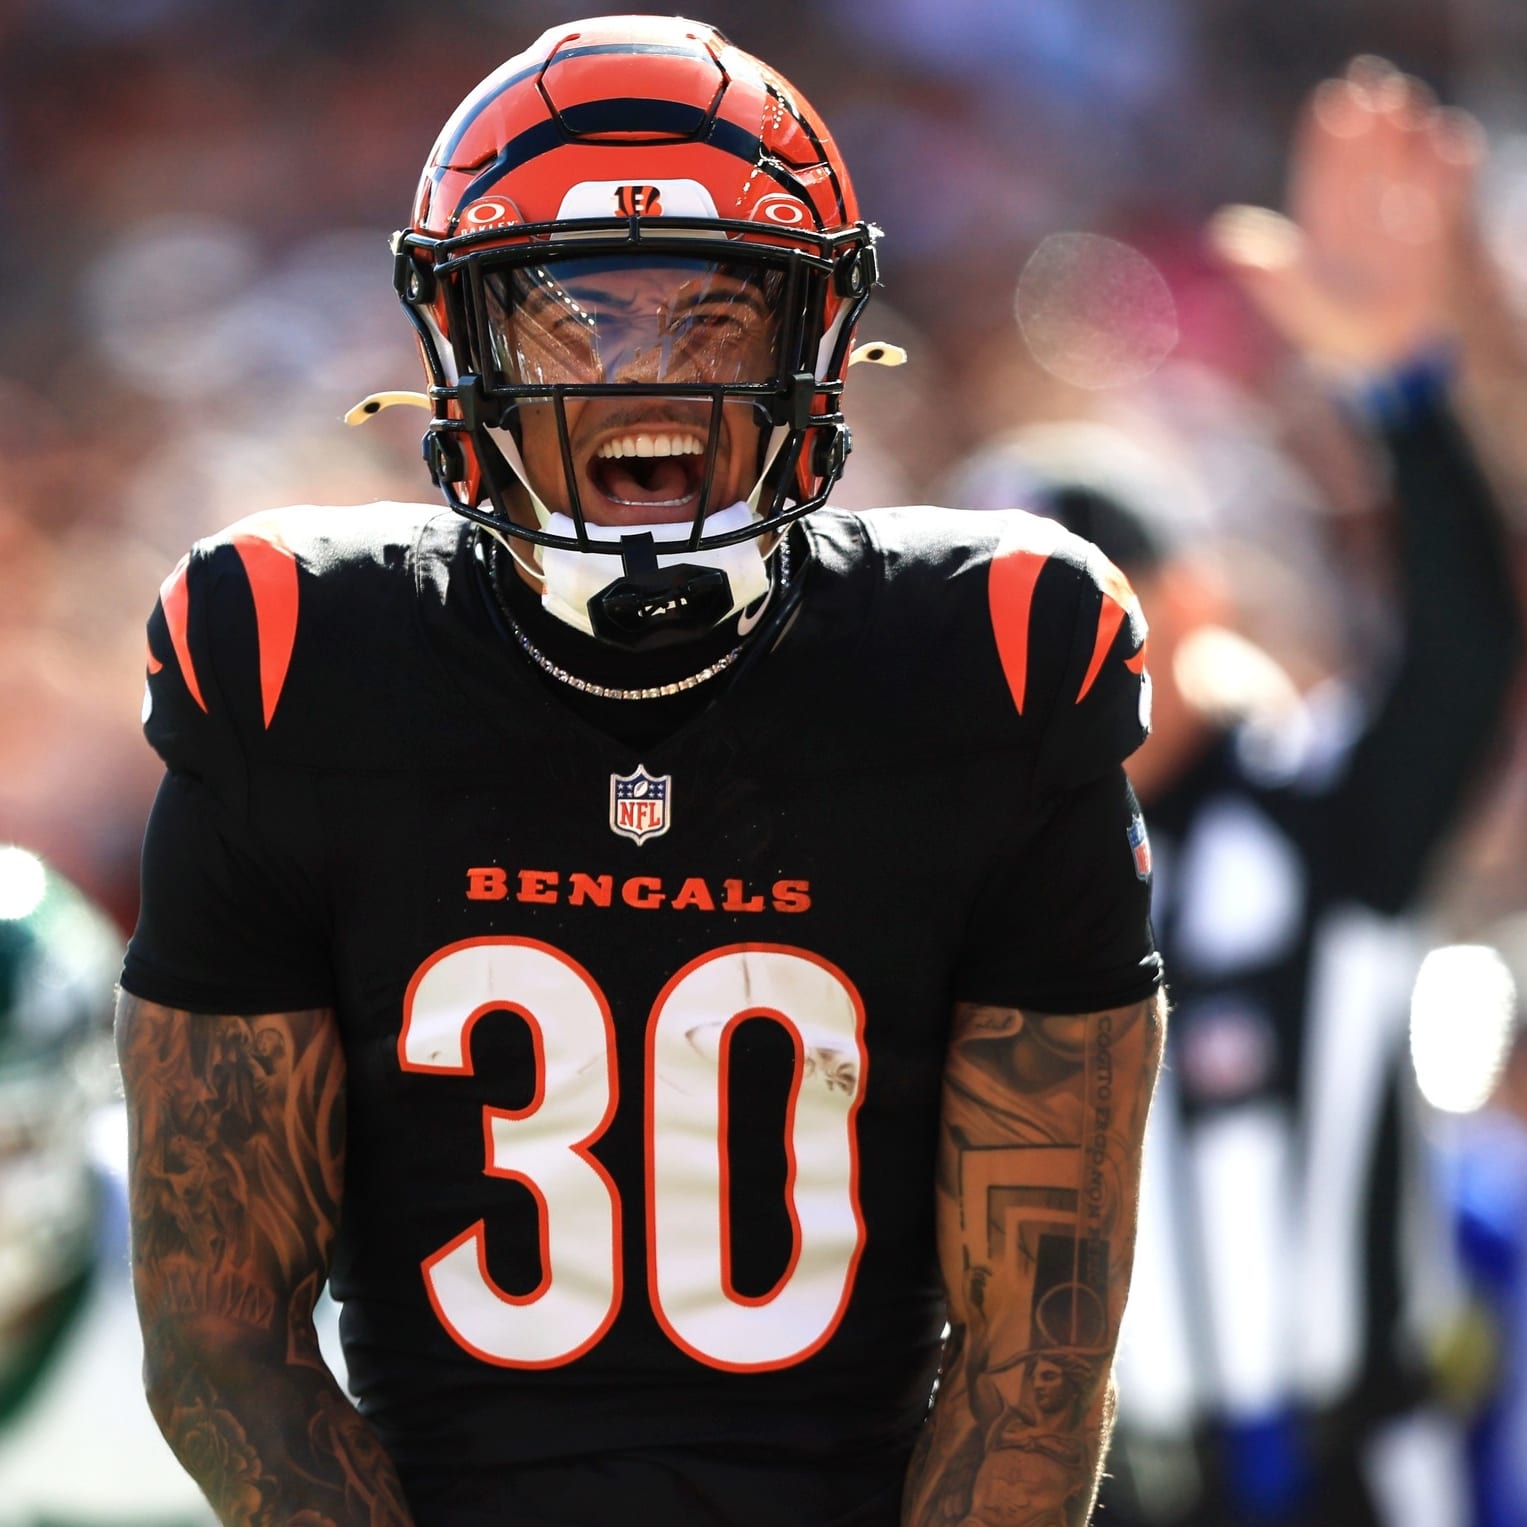
Three more games produced a 7-of-10 result. The Green Bay Packers topped the Chicago Bears with a 6.9-point average margin to Chicago's 5.7, a lean rather than a runaway. The Tennessee Titans beat the Houston Texans 7 times with a 10.7-point average margin, against only 4.0 points in Houston's wins, one of the biggest margin gaps of the week. The Miami Dolphins also won 7 of 10 against the Cincinnati Bengals, averaging 8.3 points to Cincinnati's 6.0.
NFL Week 5 Score Predictions: Six Games That Lean One Way
Six games landed at 6 of 10, and the margins tell us how much to trust each one. The Washington Commanders beat the New York Giants in 6 simulations, but their wins averaged a slate-high 12.2 points, compared with 5.2 for New York. The Dallas Cowboys took 6 of 10 from the Tampa Bay Buccaneers, averaging 7.8 points to Tampa Bay's 4.8. The Buffalo Bills won 6 of 10 on the road against the Los Angeles Rams, averaging 9.3 points to 7.2.


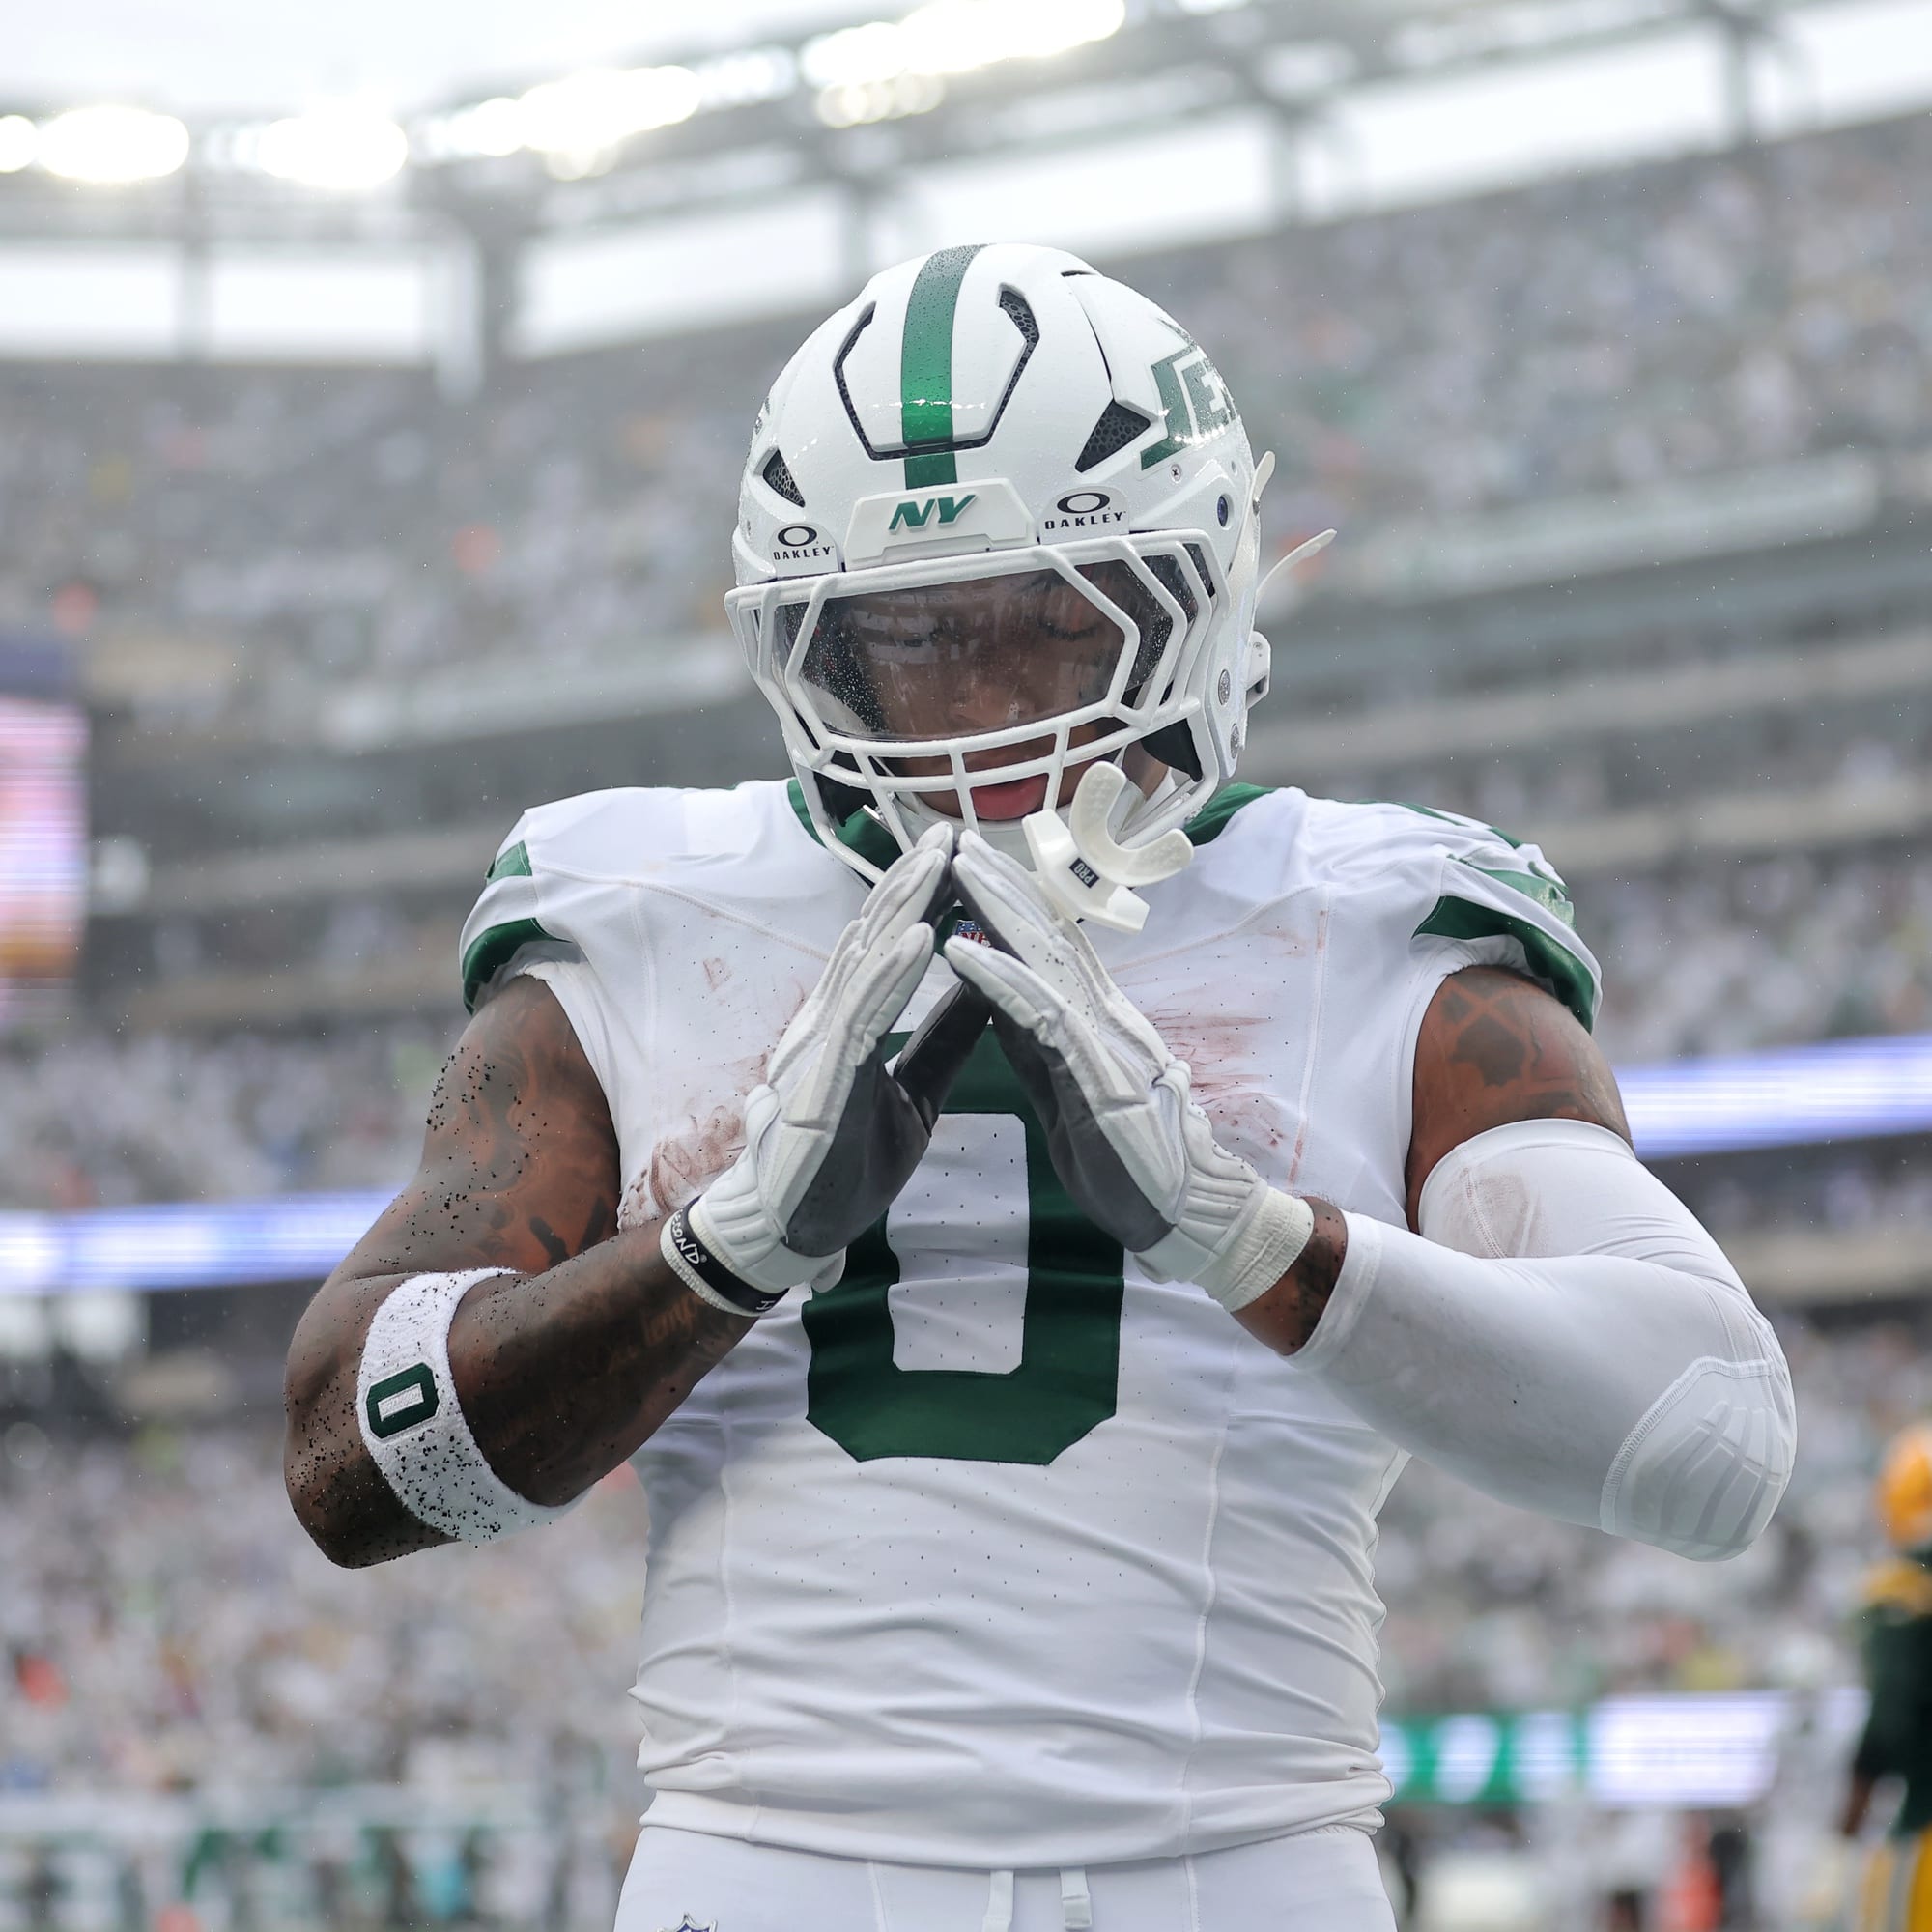
The New York Jets edged the Cleveland Browns 6 times, with a 9.8-point average margin against 4.5 for Cleveland. The most interesting split is Minnesota at New Orleans: the Vikings won 6 of 10, but the New Orleans Saints won their four with a 10.8-point average margin, against 4.7 for Minnesota. If the Saints win, the model says they win big.
The Pittsburgh Steelers' 6-of-10 result over the Indianapolis Colts is the thinnest margin among the games with a clear winner. Pittsburgh's wins averaged 5.3 points and Indianapolis' averaged 5.0, so treat that one as a coin flip with a slight tilt.
NFL Week 5 Upset Watch: Four Games Split 5-5
Four games finished exactly even, which makes them the best candidates for a surprise on Sunday. The Philadelphia Eagles and Jacksonville Jaguars split their simulations 5-5, with Jacksonville's wins averaging 11.8 points to Philadelphia's 9.4. The Las Vegas Raiders and New England Patriots also split evenly, with the Patriots' wins averaging 7.2 points to the Raiders' 5.6.
The Detroit Lions and Arizona Cardinals finished 5-5 as well, and the Lions' wins were bigger at 11.6 points to Arizona's 10.0. The Baltimore Ravens and Atlanta Falcons also split, with Baltimore averaging 11.8 points in its wins to Atlanta's 9.8. In both of those games, one side won by more when it won, but neither could claim more wins, so there is no clear edge.
What the NFL Week 5 Projections Tell Us About Home Field and Blowouts
Among the 11 games with a clear winner, home teams came out ahead in 9. Only the Vikings at the Saints and the Bills at the Rams went the way of the road team. The biggest average margins belong to the Commanders (12.2), the Ravens (11.8), the Jaguars (11.8), the Lions (11.6), the Saints (10.8) and the Titans (10.7), which tells us where blowouts are most likely when those teams win.
Methodology
Each Week 3 matchup was run through an AI-driven simulation model that scores team strength using an average margin of victory (MOV) input for each side, then simulates the matchup across 10 games to generate a projected win distribution. The higher-scoring team in the model is projected to win, with the gap between the two MOV figures indicating relative confidence in that outcome. Simulation results should be framed as directional probability, not a guaranteed outcome, particularly in games with narrow MOV gaps.
Full Week 5 Simulation Results, Game by Game
Here is where the AI simulation model lands on every Week 5 matchup:
| Matchup (Away at Home) | Sim result | Winner's wins | Avg. MOV in wins (Away / Home) |
|---|---|---|---|
| Buccaneers at Cowboys | Cowboys | 6/10 | 4.8 / 7.8 |
| Eagles at Jaguars | Even split | 5/5 | 9.4 / 11.8 |
| Bears at Packers | Packers | 7/10 | 5.7 / 6.9 |
| Texans at Titans | Titans | 7/10 | 4.0 / 10.7 |
| Bengals at Dolphins | Dolphins | 7/10 | 6.0 / 8.3 |
| Raiders at Patriots | Even split | 5/5 | 5.6 / 7.2 |
| Vikings at Saints | Vikings | 6/10 | 4.7 / 10.8 |
| Browns at Jets | Jets | 6/10 | 4.5 / 9.8 |
| Colts at Steelers | Steelers | 6/10 | 5.0 / 5.3 |
| Giants at Commanders | Commanders | 6/10 | 5.2 / 12.2 |
| Broncos at Chargers | Chargers | 9/10 | 6.0 / 7.6 |
| Lions at Cardinals | Even split | 5/5 | 11.6 / 10.0 |
| 49ers at Seahawks | Seahawks | 8/10 | 6.0 / 10.0 |
| Ravens at Falcons | Even split | 5/5 | 11.8 / 9.8 |
| Bills at Rams | Bills | 6/10 | 9.3 / 7.2 |
Source: RotoWire AI simulation model, 10 simulated games per matchup. Results are directional projections, not guaranteed outcomes.
 Theo Gremminger
See Theo's personal rankings, tiers, and draft targets.
View Rankings
RotoWire Analyst
 Ian Hartitz
See Ian's personal rankings, tiers, and draft targets.
View Rankings
RotoWire Analyst
 Jagger May
See Jagger's personal rankings, tiers, and draft targets.
View Rankings
RotoWire Analyst
 Jim Coventry
See Jim's personal rankings, tiers, and draft targets.
View Rankings
RotoWire Analyst
 Jeff Erickson
See Jeff's personal rankings, tiers, and draft targets.
View Rankings
RotoWire Analyst
 Jerry Donabedian
See Jerry's personal rankings, tiers, and draft targets.
View Rankings
RotoWire Analyst
 Mario Puig
See Mario's personal rankings, tiers, and draft targets.
View Rankings