Dynasty Strategy: Final 2024 Rookie Top 64
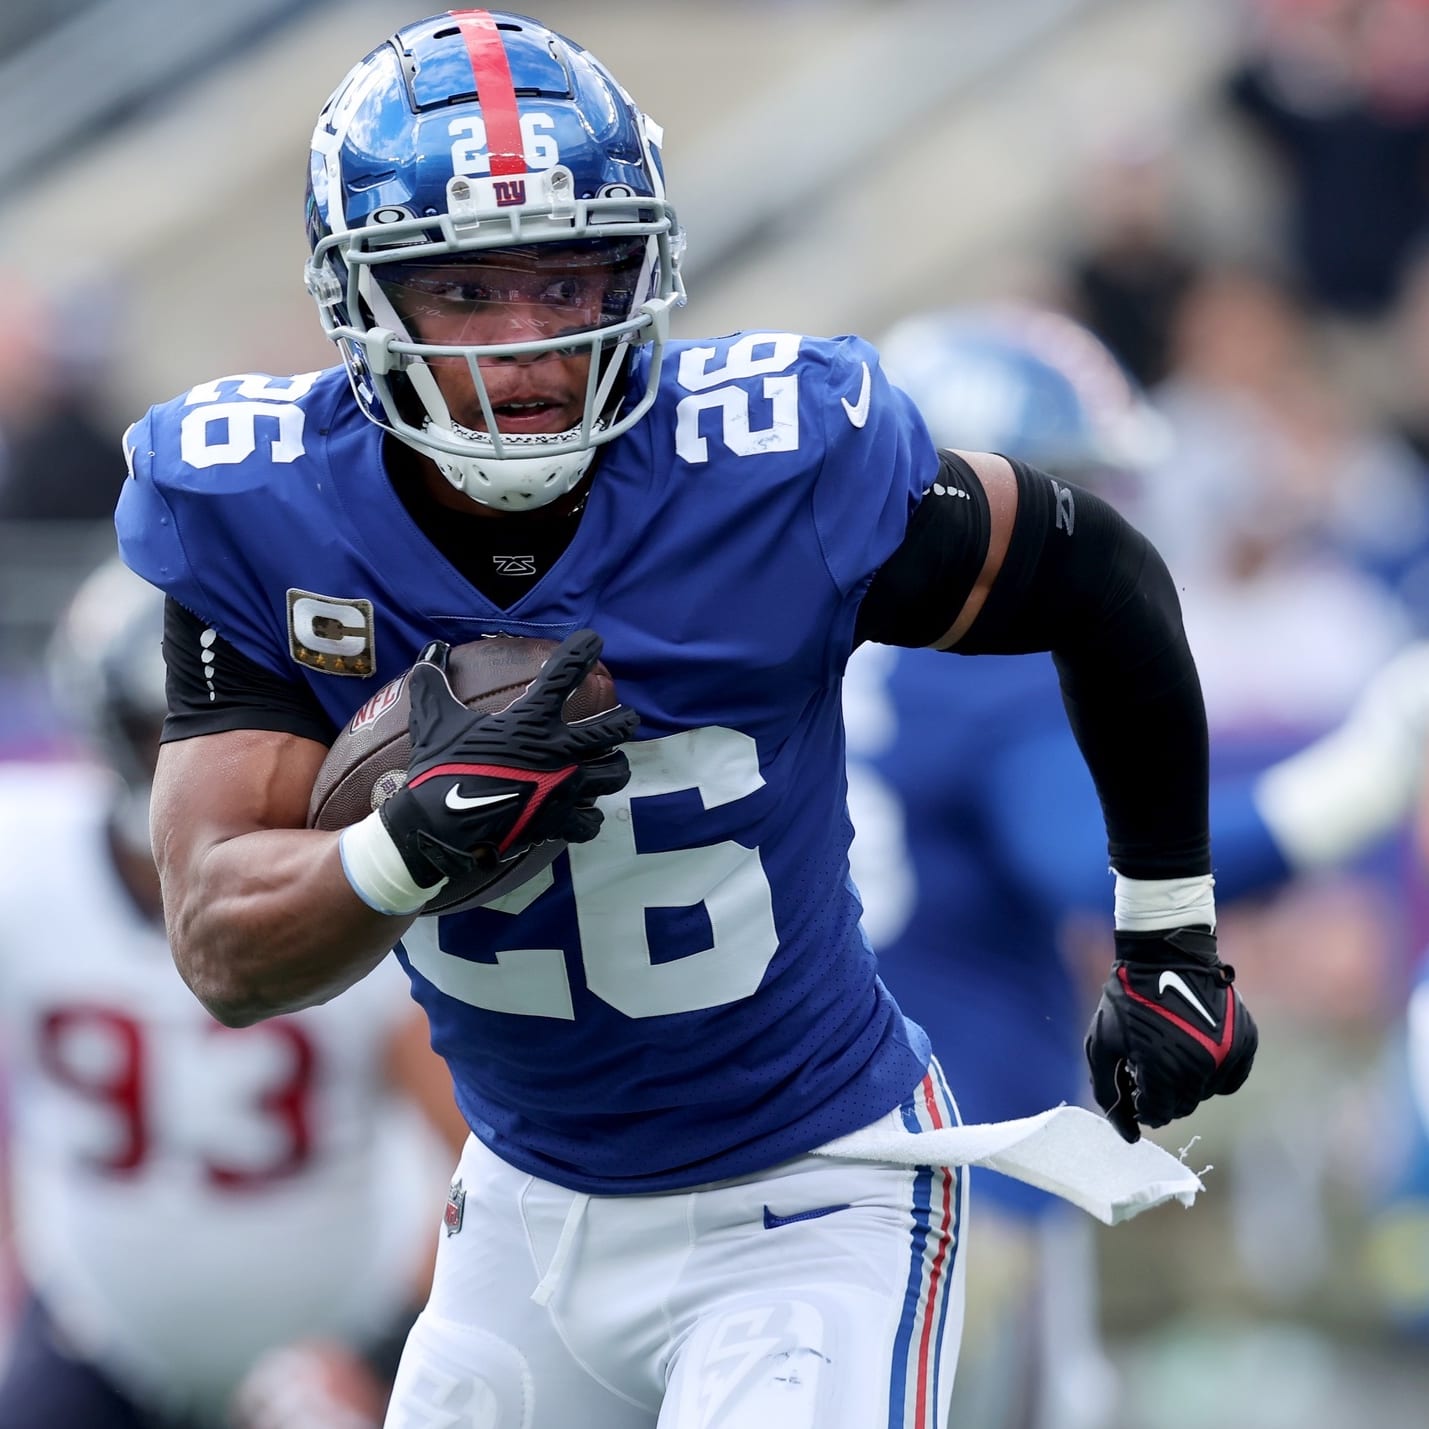
Malik Nabers is an elite wide receiver prospect, but his landing spot was bad enough to delay his full arrival.
Featured
Recent
Fantasy
DFS
Betting

NFL Dynasty Watch: Top 2024 UDFA Signings After the NFL Draft
Frank Gore Jr. could earn a backup job in Buffalo's backfield despite going undrafted. RW's Jerry Donabedian surveys the other UDFAs worth knowing in the 2024 rookie class.
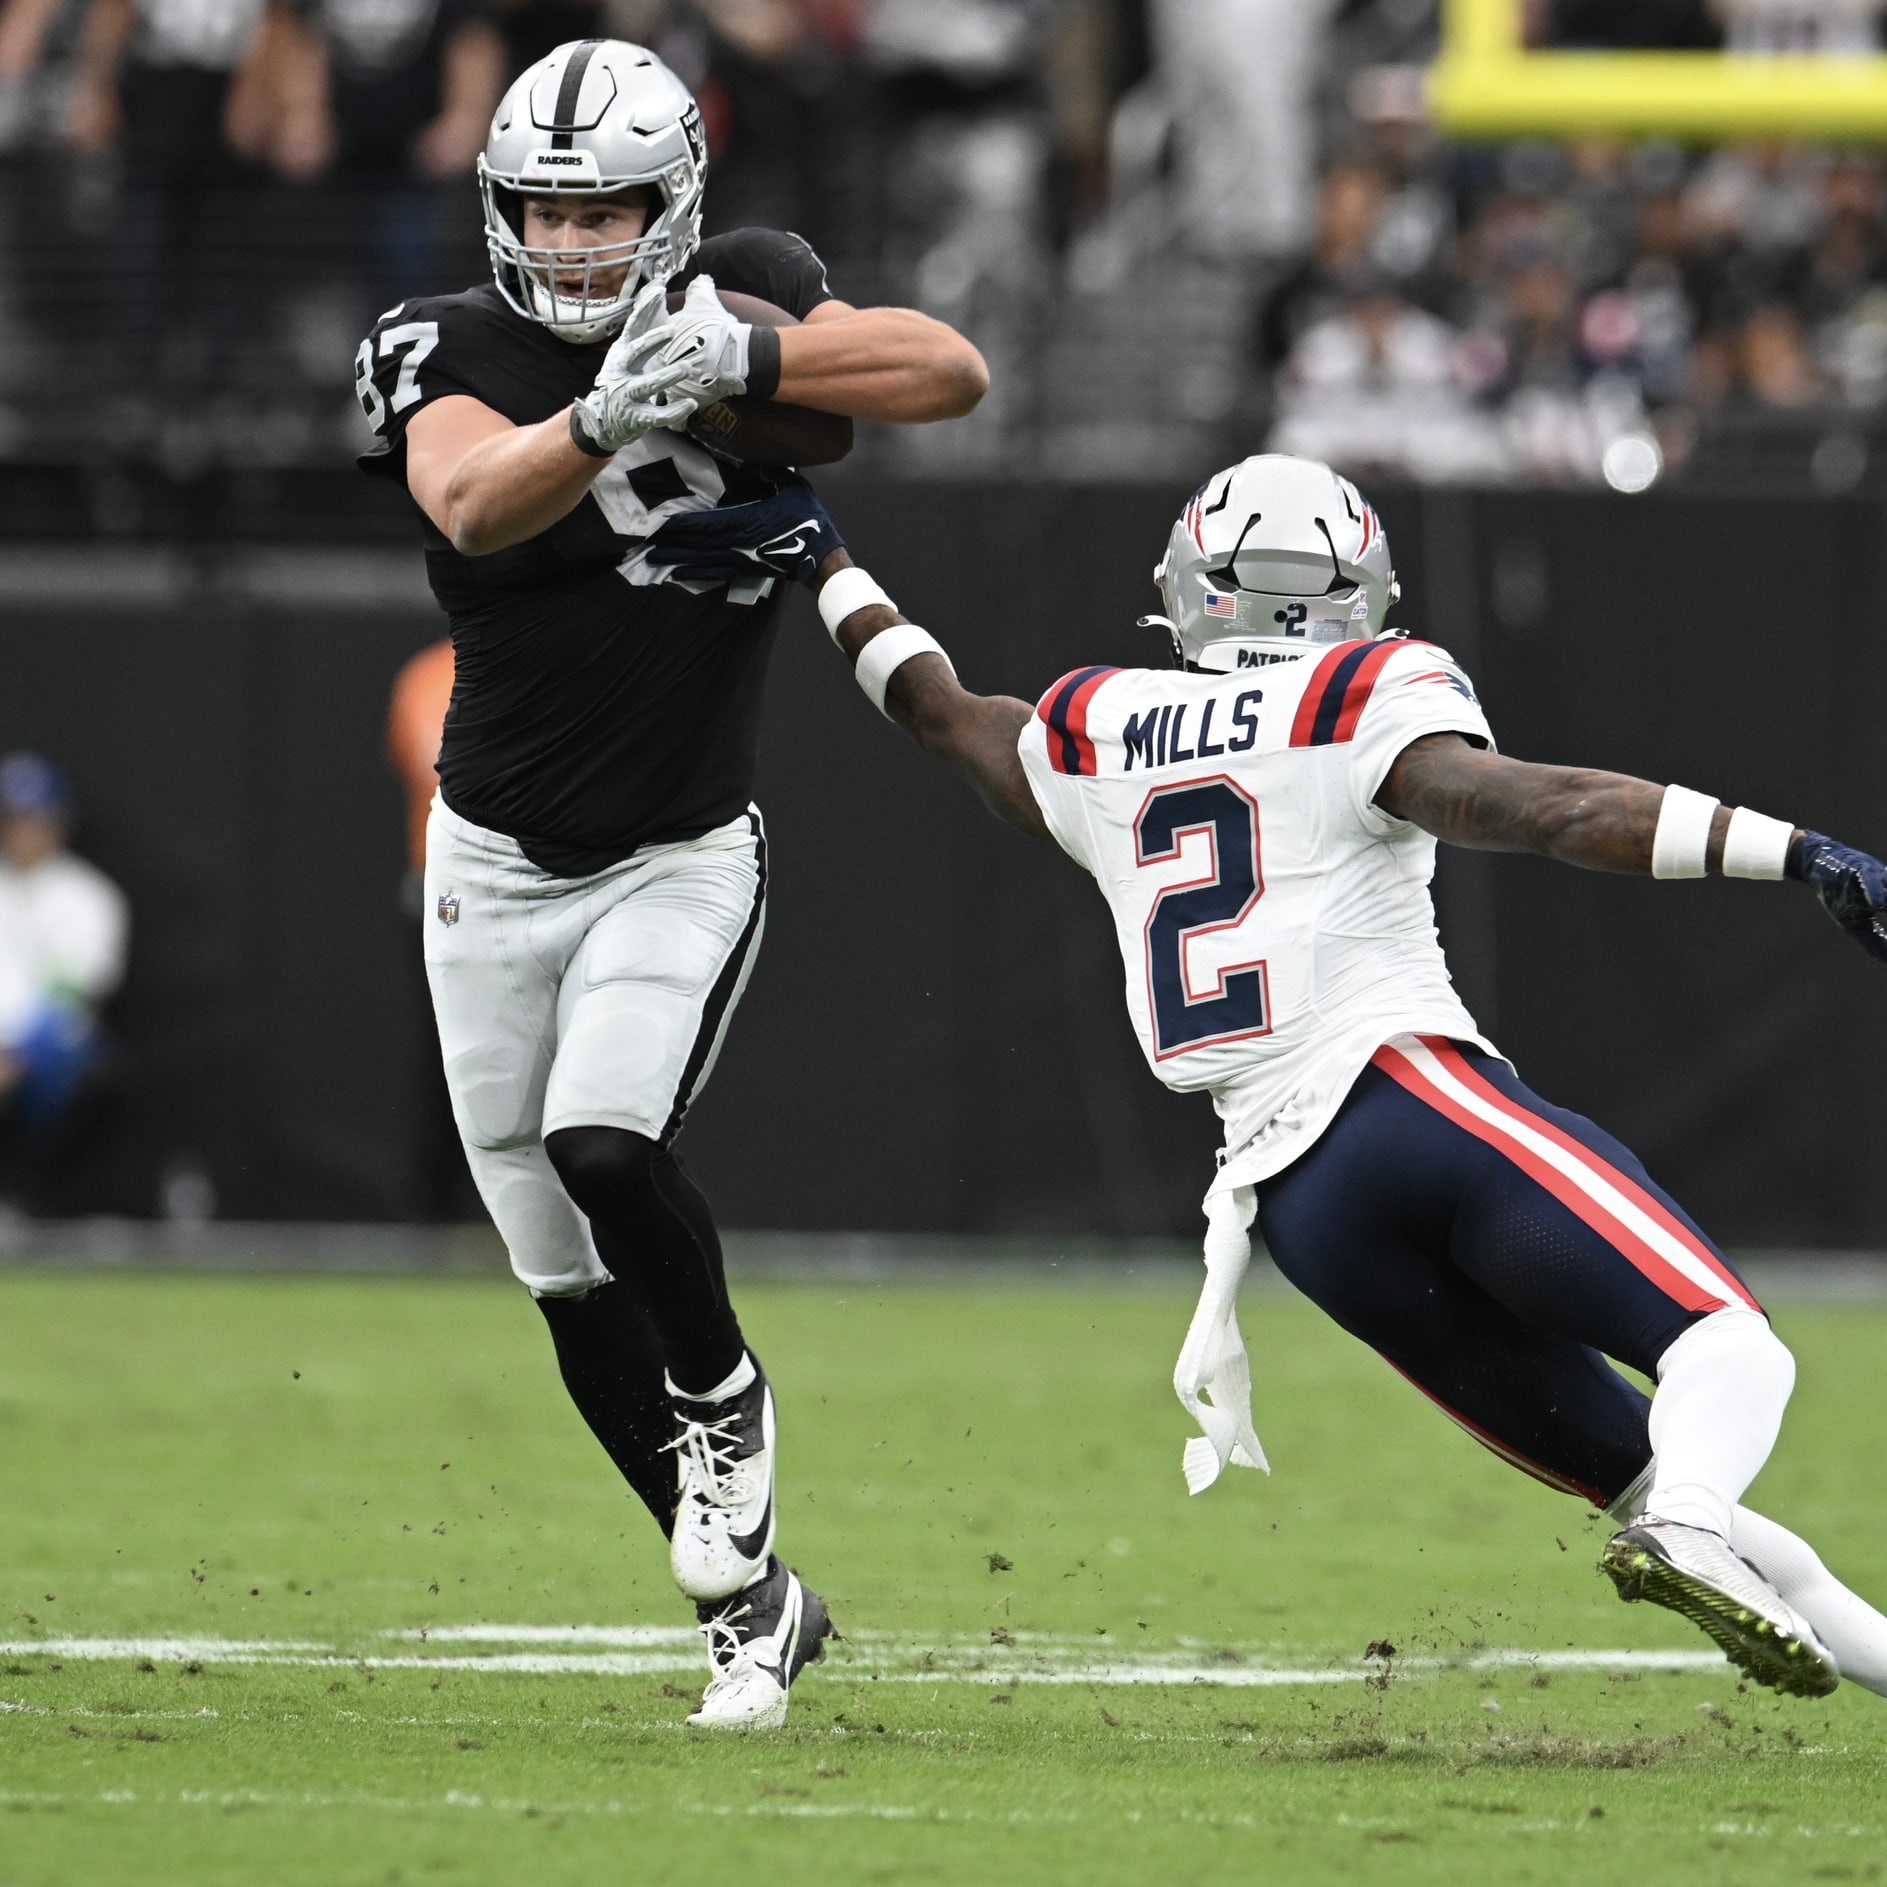
NFL Dynasty Watch: Biggest Losers from the 2024 NFL Draft
Raiders TE Michael Mayer and Colts WR Adonai Mitchell are two of the many players whose volume projections had to be adjusted downward after the 2024 NFL Draft. RW's Jerry Donabedian breaks it all down.

NFL Draft: Veteran Winners & Losers
Jim Coventry analyzes veteran winners and losers from this year's draft, including Dak Prescott, who benefited from whom the Cowboys did *not* draft.
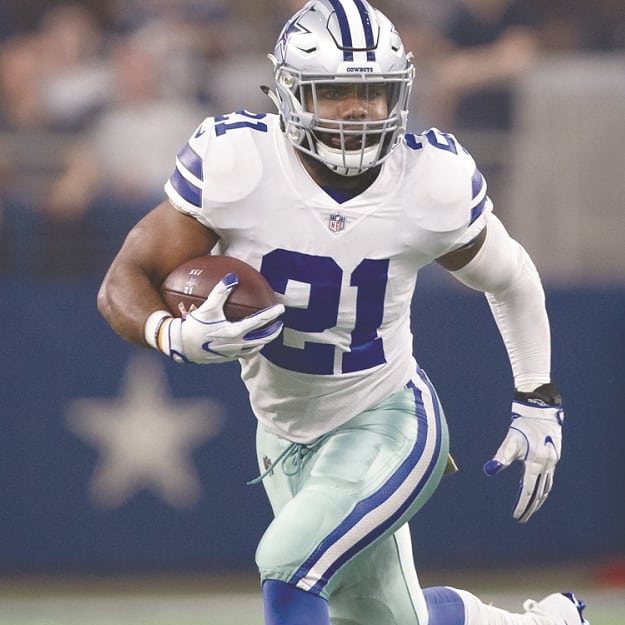
NFL Dynasty Watch: Biggest Winners from the 2024 NFL Draft
Zeke is back in Dallas and won't have to compete with a rookie draft pick for playing time. Check out the other big winners from draft weekend, with analysis from RW's Jerry Donabedian.

NFL Draft Day 2 Recap: Draft Grades and Fantasy Analysis
Day 2 of the NFL Draft featured plenty of future fantasy football stars, and Joe Bartel recaps it with analysis for all the rookies you will be drafting this season and beyond.

NFL Draft Recap: Day 1 Instant Rookie Reactions
Dig into the fantasy fallout from the first round of the NFL draft with analysis for each pick including looks at Michael Penix's fit in Atlanta and Malik Nabers' fit in New York.

Browse All Football Articles
Check out our full list of fantasy football articles now.


Top News
View More

Joe BurrowQB
Continues to progress

Tyler BoydWR
Finds home in Tennessee

Tank DellWR
Full recovery from wound expected

Markus BaileyLB
Inks deal with Arizona

Shakel BrownDT
Let go by Tennessee
Ryan SwobodaOT
Gets cut loose

Thyrick PittsWR
Ends up on IR

Kyle PekoDT
Finds new home

Jaaron HayekWR
Earns new opportunity
Reggie BrownWR
Loses spot
Nathan RourkeQB
Claimed on waivers
Fantasy Football Tools
Custom Rankings
Custom player rankings for your league with projected stats.
Cheat Sheets
A quick way to see our rankings and projected stats at a glance.
Auction Values
Get custom dollar values based on your specific league scoring system.
Draft Software
Draft software packed with features and available for Windows/Mac.
Sleepers
Check out our list of under-valued players this season.
Projections
We have projected stats for every player you care about.
Ask An Expert
Get answers to your fantasy football questions from our team of experts.
News
You can rely on our fast, high quality fantasy football news updates.
Depth Charts
Go into your draft knowing who is going to get playing time this season.
Red Zone Stats
Stats you can use to target players who'll get the ball near the goal line.
ADP Reports
Spot trends like a pro with our Average Draft Position (ADP) reports.
Custom IDP Rankings
We have IDP rankings that you can customize to fit your league.