This article is part of our Stathead Sagas series.
Good luck drafting for batting average.
Seriously, you'll need some good luck. If you subscribe to even a piece of DIPS theory -- defensive independent pitching statistics -- then you believe that pitchers have little control over whether balls in play fall in for hits. At some point -- albeit to a lesser extent -- the same theory applies to hitters. Some of the hardest hit balls drop in. Some of the weakest hit pop-ups drop just over an infielder's head and trickle away for a double.
So even those who hit the ball the hardest are subject to the brutality of luck, even throughout the course of a 162-game major league season. But talking about this luck -- or perhaps uncertainty is a better word -- doesn't do us much good. We need to put a number on it. Luckily, we can.
If you're interested in the gory mathematical details, they're available at the bottom of the post. If not, just enjoy the following chart:
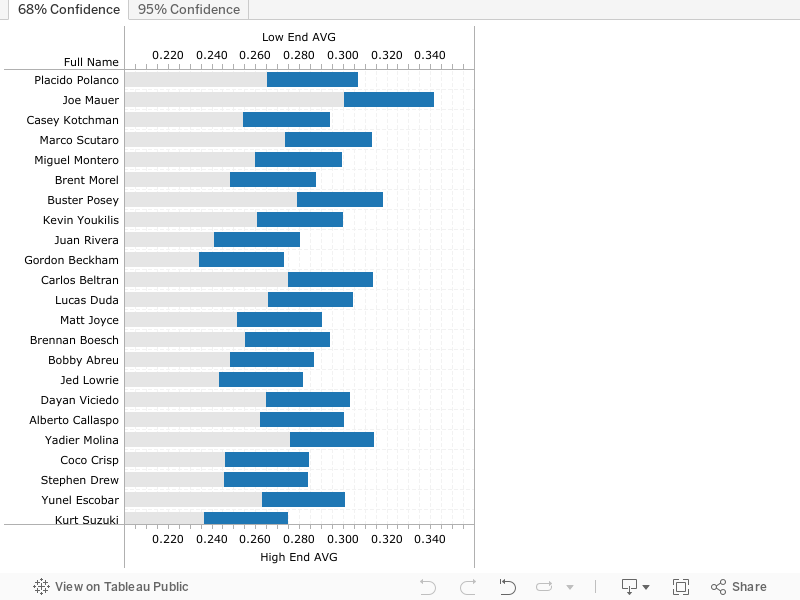
Each tab shows a different level of certainty, one with 68% (or just under 2-in-3 odds the player's average falls within this bar) and one with 95% (or 19-in-20 odds). The chart includes anybody with at least 450 projected at-bats -- almost every starting player. You can find any player you're interested in there, but I will highlight a few different types of players here.
High Average, High Certainty
Matt Kemp, Justin Upton, Robinson Cano and Adrian
Good luck drafting for batting average.
Seriously, you'll need some good luck. If you subscribe to even a piece of DIPS theory -- defensive independent pitching statistics -- then you believe that pitchers have little control over whether balls in play fall in for hits. At some point -- albeit to a lesser extent -- the same theory applies to hitters. Some of the hardest hit balls drop in. Some of the weakest hit pop-ups drop just over an infielder's head and trickle away for a double.
So even those who hit the ball the hardest are subject to the brutality of luck, even throughout the course of a 162-game major league season. But talking about this luck -- or perhaps uncertainty is a better word -- doesn't do us much good. We need to put a number on it. Luckily, we can.
If you're interested in the gory mathematical details, they're available at the bottom of the post. If not, just enjoy the following chart:
Each tab shows a different level of certainty, one with 68% (or just under 2-in-3 odds the player's average falls within this bar) and one with 95% (or 19-in-20 odds). The chart includes anybody with at least 450 projected at-bats -- almost every starting player. You can find any player you're interested in there, but I will highlight a few different types of players here.
High Average, High Certainty
Matt Kemp, Justin Upton, Robinson Cano and Adrian Gonzalez
BABIP, particularly for hitters, is not all luck, and these four players are the poster children for how hitting the ball hard on a consistent basis produces repeatedly excellent batting averages. These players combine that with good (although not necessarily great) contact rates and excellent power hitting -- the booming home run is the only hit the defense cannot take away.
High Average, Low Certainty
Joe Mauer and Josh Hamilton
Like the above category, these guys don't strike out very often, but their injury histories have them projected for a low amount of at-bats. Their inability to stay on the field prevents us from getting a great read on exactly what their true talent level is, so we get a big error bar on our estimates. Still, Hamilton's lowest-end batting average sits at a very reasonable .279, and Mauer's at .281 -- they're still good bets to help your average.
Low Average, High Certainty
Mark Reynolds, Carlos Pena and Adam Dunn
If you only get one statistic to look at when trying to figure out what a player's batting average will be the next season, look at strikeouts. Not last year's average. Not his BABIP. His strikeouts. We don't really know what will happen when a player puts the ball is put in play, but we know that nobody has ever gotten credit for a hit on a strikeout. Reynolds and Pena both top out in the .250 range and Dunn tops out at .271 -- sometimes you can draft and pray that a slugger decides to hit for average this year. Not with these guys.
Low Average, Low Certainty
Kurt Suzuki, Brett Gardner, Coco Crisp, Stephen Drew
These players don't have the crippling strikeout issue that plagues the one-tool mashers listed above. Instead, for a variety of reasons -- not hitting many home runs, low BABIPs in their career -- they haven't been able to produce a high average despite putting the ball in play often. And again, they aren't projected to play full time -- Suzuki is a catcher, Drew is dealing with an injury and is already slated to miss time, Gardner rides the pine against tough lefties, and Crisp is part of a super crowded outfield. If they get hot for a stretch of the season, they could easily turn that into a solid average -- pushing .300 is a possibility for all four.
Ugly Math
As mentioned above, the key to the math is that batting average and BABIP are binomial statistics. Due to their binary nature, there's a simple formula (as long as you have a calculator or a computer) to find just how big the error bars are. With these binomial statistics we can calculate the uncertainty (represented by σ ) using the following formula.
σ = (sqrt(BABIP(1-BABIP)))/BIP
BIP = Balls in Play = AB - K - HR (all non-home run hits, all non-strikeout outs).
Now, using this formula with the projections available on the site here, we can calculate just how certain we can be about each player's batting average this season. 68 percent of the time, the player's BABIP will fall between his projected average plus or minus σ; 95% of the time, the player's BABIP will fall between his projected average plus or minus double σ. Using these BABIP ranges, I constructed the overall average ranges we see above.
If you're interested in reading about the entire process, go here, click "search inside" and type in "Random Variation in Binomials." Also, buy The Book, because it is fantastic.