


This article is part of our Stathead Sagas series.
When it comes to analyzing statistics in sports -- in anything, really -- context is key. Without some frame of reference to measure the numbers against, raw statistics are completely meaningless. This is becoming particularly true for baseball as the landscape of MLB changes. Last season was a "Year of the Pitcher," with run scoring down to levels not seen since well before the Steroids Era. Batting averages of .260 moved from mediocre to above average, and ERAs of 4.00 went from characteristic of a No. 3 starter to a No. 5.
And so when I find myself looking at historical stats, it's easy to forget that a 4.25 ERA back in 2002 was actually pretty good, or that a guy with a .250 batting average may have been a totally useless fantasy player. To really put things into perspective, Masato Yoshii, who pitched for five years in the NL around the turn of the millennium, had a 4.62 ERA and a 101 ERA+ -- that is, he was roughly 1% better than the average pitcher with that line. His 5.86 ERA with Colorado in 2000 earned a 99 ERA+ -- Coors field in 2000 may have been the single toughest place to pitch in the history of baseball.
Point being, with the game clearly changing, we need to step back and reevaluate where the game is today. With one month's worth of games in the books, now is as good a time as ever to dive into the numbers
When it comes to analyzing statistics in sports -- in anything, really -- context is key. Without some frame of reference to measure the numbers against, raw statistics are completely meaningless. This is becoming particularly true for baseball as the landscape of MLB changes. Last season was a "Year of the Pitcher," with run scoring down to levels not seen since well before the Steroids Era. Batting averages of .260 moved from mediocre to above average, and ERAs of 4.00 went from characteristic of a No. 3 starter to a No. 5.
And so when I find myself looking at historical stats, it's easy to forget that a 4.25 ERA back in 2002 was actually pretty good, or that a guy with a .250 batting average may have been a totally useless fantasy player. To really put things into perspective, Masato Yoshii, who pitched for five years in the NL around the turn of the millennium, had a 4.62 ERA and a 101 ERA+ -- that is, he was roughly 1% better than the average pitcher with that line. His 5.86 ERA with Colorado in 2000 earned a 99 ERA+ -- Coors field in 2000 may have been the single toughest place to pitch in the history of baseball.
Point being, with the game clearly changing, we need to step back and reevaluate where the game is today. With one month's worth of games in the books, now is as good a time as ever to dive into the numbers and see if the pitcher-friendly trends are continuing. To the chart:
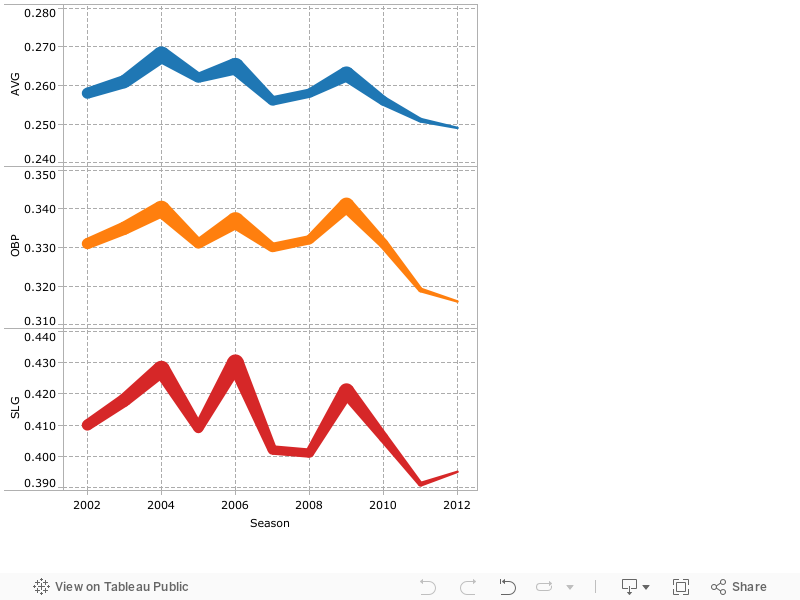
The difference between the last two seasons and the preceding decade is striking. Offense has fallen off a cliff. It peaked at 4.9 runs per game in April of 2004 as the league recorded a .340 OBP and .428 SLG, roughly matched in April of 2009. And then last year, players managed just a .251/.319/.391 line in April. Run scoring declined seven-tenths of a run per game in just two year's time. And although that might not sound like such a big deal, check out the differences in the category-winning scores in the RotoWire Staff Keeper League (an 18-team mixed league) in 2009 and again in 2011:
| Stat | #1 in '09 | #1 in '11 | #9 in '09 | #9 in '11 |
|---|---|---|---|---|
| AVG | 0.2819 | 0.2803 | 0.2701 | 0.2605 |
| R | 1103 | 1036 | 975 | 878 |
| RBI | 1073 | 1014 | 921 | 882 |
| HR | 287 | 276 | 239 | 199 |
| SB | 188 | 185 | 123 | 144 |
| W | 101 | 109 | 79 | 81 |
| SV | 98 | 104 | 61 | 57 |
| K | 1291 | 1332 | 1056 | 1169 |
| ERA | 3.5336 | 3.3969 | 4.0877 | 3.8038 |
| WHIP | 1.2592 | 1.1937 | 1.3308 | 1.2717 |
Although batting average and home run totals haven't changed quite as much at the top, they have in the middle of the leagues, and we see stark changes in all of the counting stats. Both runs and RBI dropped by about 100, or roughly 10%, and in the middle we see batting average and home runs exhibiting larger drops as well. We see the expected reverse effect on pitching staffs, albeit a bit muted in wins and saves (somebody has to get the win every game no matter how many runs are scored). The stolen base category, on the other hand, has moved in the other direction. I detailed this phenomenon in the first installment of this column prior to the season:
When seemingly every hitter is capable of getting on base or even hitting a home run, as was the case as the Athletics rose to power during the Steroids Era, throwing away that out is dangerous, and often not even worth the attempt. In the pitchers' era we seem to be entering -- the league OPS has dropped from .759 to .720 since 2001 and teams now combine to score one fewer run per game -- the relative benefit of stealing bases increases greatly.
Given the slight drop in offense from 2011 to 2012 so far, we should expect this trend to continue. Run scoring is down 0.13 runs per game, meaning we might even see another slight uptick in running – perhaps that's why we see guys like Tony Campana who offer steals but little else going for 20% (or more) of FAAB budgets in some leagues. As boring as it might sound to say, "Hey, things are pretty much the same as last year," sometimes the most important result of a study is that of no significant change. Although offense will continue to tick slowly upwards along with the thermometer as we approach the dog days of summer, it looks like 2011 is set to be another year of the pitcher. As such, category targets for the season should stay relatively similar to last year: low offensive stats outside of stolen bases, and pitching standards will be as high as ever -- as long as you weren't playing fantasy baseball in 1968, that is.


