
In a recent piece about how running backs decline with age, I received quite a few comments about seeing the data in terms of career carries instead. Here's a look from that angle.
Data
I collected the stats of the top-100 rushers from 1961 to 2010 (data gathered from NFL.com). I then applied a minimum standard of 100 rushing attempts in a season to the data set. This captured a total of 673 RBs. Then, I re-included any season for those 673 players which did not meet the 100 rushing attempts minimum. Thus, the final data set includes 3,767 records from the 673 qualifying RBs.
Analysis of Data
The data was grouped by age versus average rushing yards with the number of career carries included as well as the number of players in that age group. The data is shown below in table format. The data is only from players aged 21 to 30.
| Age | Player Count | Average Career Carries | Average Yards |
|---|---|---|---|
| 21 | 71 | 133.6 | 568.3 |
| 22 | 286 | 275.4 | 589.2 |
| 23 | 459 | 416.5 | 583.4 |
| 24 | 485 | 564.1 | 609.6 |
| 25 | 455 | 712.0 | 600.3 |
| 26 | 415 | 862.0 | 611.4 |
| 27 | 366 | 1007.7 | 582.6 |
| 28 | 285 | 1146.9 | 557.2 |
| 29 | 212 | 1282.3 | 548.9 |
| 30 | 147 | 1411.0 | 514.4 |
While the table is nice, the chart is a much better depiction of the data.
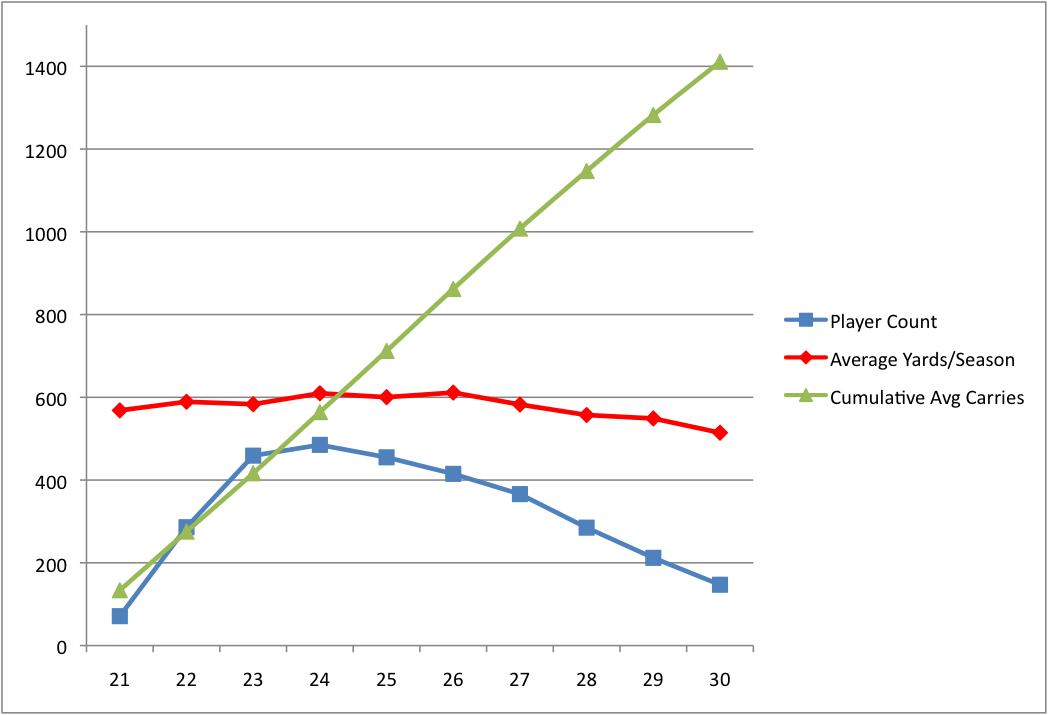
From the chart, the blue line is the number of players at that age, the red line is the average yards for that age and the green line is the cumulative of
In a recent piece about how running backs decline with age, I received quite a few comments about seeing the data in terms of career carries instead. Here's a look from that angle.
Data
I collected the stats of the top-100 rushers from 1961 to 2010 (data gathered from NFL.com). I then applied a minimum standard of 100 rushing attempts in a season to the data set. This captured a total of 673 RBs. Then, I re-included any season for those 673 players which did not meet the 100 rushing attempts minimum. Thus, the final data set includes 3,767 records from the 673 qualifying RBs.
Analysis of Data
The data was grouped by age versus average rushing yards with the number of career carries included as well as the number of players in that age group. The data is shown below in table format. The data is only from players aged 21 to 30.
| Age | Player Count | Average Career Carries | Average Yards |
|---|---|---|---|
| 21 | 71 | 133.6 | 568.3 |
| 22 | 286 | 275.4 | 589.2 |
| 23 | 459 | 416.5 | 583.4 |
| 24 | 485 | 564.1 | 609.6 |
| 25 | 455 | 712.0 | 600.3 |
| 26 | 415 | 862.0 | 611.4 |
| 27 | 366 | 1007.7 | 582.6 |
| 28 | 285 | 1146.9 | 557.2 |
| 29 | 212 | 1282.3 | 548.9 |
| 30 | 147 | 1411.0 | 514.4 |
While the table is nice, the chart is a much better depiction of the data.
From the chart, the blue line is the number of players at that age, the red line is the average yards for that age and the green line is the cumulative of the average carries per age.
Conclusion
As noted in my prior article and evident here, production declines for RBs at age 27, as depicted by the shape of the red line. The corresponding cumulative average carries at this age is almost exactly 1,000. While the data indicate this as the carries threshold, I think this is a bit low. However, we are talking about your "average" RB and not the greatest RBs of all time. Perhaps a more in depth analysis of the top 300 RBs of all time would be a better representation.