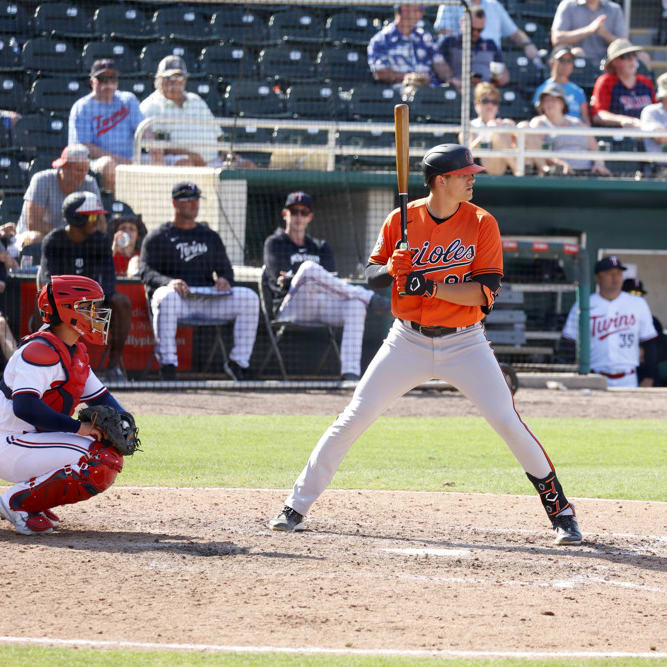
Trey Mancini

31-Year-Old First Baseman1B
2023 Fantasy Outlook
Mancini certainly felt the effects of the new dimensions at Camden Yards as his production before he was dealt to Houston. His overall numbers were just slightly above the league average for a second consecutive season, but his production in Houston was far less than in Baltimore. He hit just .176/.258/.364 after the trade compared to .267/.347/.404 before it. His 2019 season (35 HR) is unlikely to happen again, but 20 homers and 60-70 runs scored and runs driven in is certainly in the realm of realistic outcomes. It is tough to figure out a batting average projection for someone who has hit anywhere from .239 to .291 in recent seasons, especially someone as slow. He needs a heavy dose of batted ball luck to repeat his batting averages of 2017 and 2019, but given a different baseball than those seasons, it is safer to hope for a .250 batting average. He still qualifies in the outfield this season but is unlikely to see much action there after he signed a two-year deal with the Cubs given his defensive deficiencies. Mancini should split playing time at first base and designated hitter with Eric Hosmer and is clearly the better option of the two. Read Past Outlooks
RANKSFrom Preseason
#256
ADP
$Signed a one-year, $7 million contract with the Cubs in January of 2023. Contract includes $7 million player option for 2024.
Back to bench Monday
1BChicago Cubs
May 29, 2023
Mancini is out of the lineup for Monday's game against the Rays.
ANALYSIS
After sitting out four consecutive games from last Sunday through Wednesday, Mancini returned to the lineup as either the Cubs' designated hitter or starting first baseman for all three of the team's games with Cincinnati this past weekend. Mancini went 0-for-6 over the first two contests, but he salvaged his series with a 2-for-3 effort to go with a walk in Sunday's 8-5 loss. Even so, Mancini is still maintaining a pedestrian .683 OPS for the season, and he looks like he could be stuck in more of a part-time role until his bat heats up and he warrants more playing time.
Read More News
Batting Stats
Loading Batting Stats...
2023
2022
2021
2020
2019
2018
2017
2023 MLB Game Log
Calculate Stats Over Time
Just click on any two dates.
Scoring
FanDuel
DraftKings
Yahoo DFS
Loading Batting Game Log...
2022 MLB Game Log
Calculate Stats Over Time
Just click on any two dates.
Scoring
FanDuel
DraftKings
Yahoo DFS
Loading Batting Game Log...
2021 MLB Game Log
Calculate Stats Over Time
Just click on any two dates.
Scoring
FanDuel
DraftKings
Yahoo DFS
Loading Batting Game Log...
2020 MLB Game Log
Calculate Stats Over Time
Just click on any two dates.
Scoring
FanDuel
DraftKings
Yahoo DFS
Loading Batting Game Log...
2019 MLB Game Log
Calculate Stats Over Time
Just click on any two dates.
Scoring
FanDuel
DraftKings
Yahoo DFS
Loading Batting Game Log...
2018 MLB Game Log
Calculate Stats Over Time
Just click on any two dates.
Scoring
FanDuel
DraftKings
Yahoo DFS
Loading Batting Game Log...
2017 MLB Game Log
Calculate Stats Over Time
Just click on any two dates.
Scoring
FanDuel
DraftKings
Yahoo DFS
Loading Batting Game Log...
Minor League Game Log
Calculate Stats Over Time
Just click on any two dates.
Loading Minor League Batting Game Log...
Batting Order Slot Breakdown
vs Right-Handed Pitchers
vs RHP
#1
#2
#3
#4
#5
#6
#7
#8
#9
1
12
8
1
3
vs Left-Handed Pitchers
vs LHP
#1
#2
#3
#4
#5
#6
#7
#8
#9
2
5
1
5
Left/Right Batting Splits
Since 2021
 
 
+11%
OPS vs LHP
2023
 
 
+16%
OPS vs LHP
2022
 
 
+14%
OPS vs RHP
2021
 
 
+32%
OPS vs LHP
OPS PA R HR RBI SB AVG OBP SLG
Since 2021vs Left .781 463 54 16 53 0 .263 .339 .442
Since 2021vs Right .701 903 98 26 97 0 .241 .316 .386
2023vs Left .755 53 7 1 4 0 .267 .377 .378
2023vs Right .649 110 12 2 12 0 .250 .309 .340
2022vs Left .650 187 13 4 14 0 .234 .299 .351
2022vs Right .738 400 43 14 49 0 .241 .328 .411
2021vs Left .899 223 34 11 35 0 .288 .363 .535
2021vs Right .680 393 43 10 36 0 .237 .305 .374
More Splits View More Split Stats
Home/Away Batting Splits
Since 2021
 
 
+21%
OPS at Home
2023
 
 
+35%
OPS at Home
2022
 
 
+9%
OPS at Home
2021
 
 
+29%
OPS at Home
OPS PA R HR RBI SB AVG OBP SLG
Since 2021Home .795 699 87 27 84 0 .272 .343 .452
Since 2021Away .658 667 65 15 66 0 .224 .303 .355
2023Home .771 91 11 3 10 0 .272 .352 .420
2023Away .571 72 8 0 6 0 .234 .306 .266
2022Home .741 294 33 10 35 0 .259 .327 .414
2022Away .678 293 23 8 28 0 .219 .311 .367
2021Home .853 314 43 14 39 0 .284 .357 .496
2021Away .660 302 34 7 32 0 .226 .295 .365
More Splits View More Split Stats
Stat Review
How does Trey Mancini compare to other hitters?
This section compares his stats with all batting seasons from the previous three seasons (minimum 400 plate appearances)*. The bar represents the player's percentile rank. For example, if the bar is halfway across, then the player falls into the 50th percentile for that stat and it would be considered average.

* Exit Velocity and Barrels/PA % are benchmarked against 2019 data (min 400 PA) and Hard Hit Rate is benchmarked against last season's data (min 400 PA). See here for more exit velocity/barrels stats plus an explanation of current limitations with that data set.
  • BB/K
    Walk to strikeout ratio
  • BB Rate
    The percentage of plate appearances resulting in a walk.
  • K Rate
    The percentage of plate appearances resulting in a strikeout.
  • BABIP
    Batting average on balls in play. Measures how many of a batter’s balls in play go for hits.
  • ISO
    Isolated Power. Slugging percentage minus batting average. A computation used to measure a batter's raw power.
  • AVG
    Batting average. Hits divided by at bats.
  • OBP
    On Base Percentage. A measure of how often a batters reaches base. Roughly equal to number of times on base divided by plate appearances.
  • SLG
    Slugging Percentage. A measure of the batting productivity of a hitter. It is calculated as total bases divided by at bats.
  • OPS
    On base plus slugging. THe sum of a batter's on-base percentage and slugging percentage.
  • wOBA
    Weighted on-base average. Measures a player's overall offensive contributions per plate appearance. wOBA combines all the different aspects of hitting into one metric, weighting each of them in proportion to their actual run value.
  • Exit Velocity
    The speed of the baseball as it comes off the bat, immediately after a batter makes contact.
  • Hard Hit Rate
    A measure of contact quality from Sports Info Solutions. This stat explains what percentage of batted balls were hit hard vs. medium or soft.
  • Barrels/PA
    The percentage of plate appearances where a batter had a batted ball classified as a Barrel. A Barrel is a batted ball with similar exit velocity and launch angle to past ones that led to a minimum .500 batting average and 1.500 slugging percentage.
  • Expected BA
    Expected Batting Average.
  • Expected SLG
    Expected Slugging Percentage.
  • Sprint Speed
    The speed of a runner from home to first, in feet per second.
  • Ground Ball %
    The percentage of balls put in play that are on the ground.
  • Line Drive %
    The percentage of balls put in play that are line drives.
  • Fly Ball %
    The percentage of balls put in play that are fly balls.
BB/K
0.36
 
BB Rate
9.8%
 
K Rate
27.6%
 
BABIP
.347
 
ISO
.097
 
AVG
.255
 
OBP
.331
 
SLG
.352
 
OPS
.683
 
wOBA
.306
 
Exit Velocity
89.4 mph
 
Hard Hit Rate
26.7%
 
Barrels/PA
2.4%
 
Expected BA
.218
 
Expected SLG
.330
 
Sprint Speed
23.2 ft/sec
 
Ground Ball %
50.5%
 
Line Drive %
19.8%
 
Fly Ball %
29.7%
 
Advanced Batting Stats
Loading Advanced Batting Stats...
Additional Stats
Games By Position
Defensive Stats
Loading Games Played by Position...
Loading MLB Defensive Stats...
Batted Ball Stats
Loading Batted Ball Stats...
Stats Vs Upcoming Pitchers
Want more matchup stats?
Loading Matchup Stats...
Our full team depth charts are reserved for RotoWire subscribers.
Subscribe Now
Recent RotoWire Articles Featuring Trey Mancini See More
MLB Barometer: Splitting Small Samples
19 days ago
Erik Halterman discusses the week’s hot players, starting with Masataka Yoshida, who’s slashed .438/.479/.750 over the course of a still-active 16-game hitting streak.
NL FAAB Factor: Waiver Pickups of the Week
22 days ago
In this week's edition, Jan Levine profiles a couple NL pitchers who are in line for more playing time.
MLB FAAB Factor: Waiver Pickups of the Week
25 days ago
Jason Shebilske digs deep for these FAAB picks, starting with former Dodger top prospect Miguel Vargas' recent hot streak putting him on the fantasy radar.
MLB DFS Picks: FanDuel Plays and Lineup Strategy for Thursday, May 4
25 days ago
Kevin Payne checks out Thursday's slate as George Kirby and the Mariners wrap up a series in Oakland.
Yahoo DFS Baseball: Wednesday Plays and Strategy
26 days ago
Mike Barner recommends checking out a Guardians stack Wednesday against the Yankees.
Past Fantasy Outlooks
2022
2021
2020
2019
2018
2017
2016
After battling cancer, Mancini came back and hardly skipped a beat. While he didn't hit over 30 home runs like he did in 2019 when Major League Baseball was using the infamous juiced ball, the homer total was comparable to his earlier seasons. His walk and strikeout rates remain constant. He still doesn't steal bases (two in his career) and he might have worn down as the season went on, with his OPS dropping from .791 in the first half to .711 in the second half. Most of that OPS loss was the result of a decline in power (.204 ISO to .128 ISO). It's a long season, and Mancini should be commended for playing in 147 games after such a serious health scare. A full offseason with his focus on the game of baseball should help him take a step forward this season.
In mid-March 2020, Mancini was diagnosed with a malignant tumor in his colon. He underwent surgery and embarked on a long recovery process, sidelining him the entire season. Late last year, Mancini reported his latest bloodwork revealed no tumor DNA and he was already working out in an effort to be ready for spring training. When Mancini last took the field in 2019, he was one of the many benefiting from the Happy Fun Ball. He launched a career-best 35 homers that year, but considering the long layoff, it's best to temper expectations, especially early. Mancini was one of the more durable and reliable players in the league and should qualify at first base and in the outfield based on 2019 games played. Assuming no one is paying for Mancini's 2019 numbers, he's a candidate to supply discounted power, in a climate where useful cheap power is hard to find.
Even bad teams score runs. Look no further than Mancini's combined 203 runs and RBI, tied for 20th in MLB. Mancini's 74th percentile hard-hit rate with a relatively low 7.8-degree launch angle favors average over power. However, he clubbed a personal best 35 homers, a remarkable total considering a 32% flyball rate. It wasn't just a Camden Yards thing as Mancini slugged 17 long balls on the road. The homers were earned as illustrated by a 342.8-feet average flyball distance, the 11th longest among qualified hitters. Last season, Mancini split time between first base and outfield and is likely to do so again. The dual eligibility combined with a stable skill set and durability (averaging 152 games the past three seasons) render the righty a solid fantasy hitter, providing stability so risks can be taken elsewhere. With limited speed, Mancini's ceiling is capped unless he elevates the ball more.
Boom-boom had somewhat similar numbers in 2017 and 2018. He repeated his home-run total from his breakout 2017 season, although he needed 50 more plate appearances to get there. He scored a few more runs, thanks to those extra plate appearances, despite a 39-point drop in his on-base percentage. He is a bit of an oddball at the plate because, as a righty, he has been rather terrible against lefty pitchers the past two seasons, and was especially bad against them last year (.225/.287/.364). The only thing worse than his hitting lefties is watching him play the outfield. He has a good arm and can throw well from left field, but his lateral movement can be measured by laying down a yardstick without picking it up again. Statcast says there was more to his contact than the final numbers showed last year, but in a division loaded with quality lefty pitchers, there is a limit to his upside. As long as he stays in Camden, he can pull 20 homers.
There are not too many combinations in baseball better than being a right-handed pull hitter in Camden Yards. The slugger surprised us all when he not only made the Opening Day roster, but stayed on it all year and produced better power numbers than he had anywhere in the minor leagues. The problem for Mancini is this: he had a 51.0 percent groundball rate. Can he continue to hit one of every five flyballs out of the yard? Both are sustainable numbers for any hitter, and we still do not have enough batted balls in play to know confidently the sum of Mancini's abilities. His groundball rate was split neutral, but his HR/FB rate dropped to 16.1 percent in the second half from 23.7 percent in the first half. As long as he gets to hit in Baltimore, he is a decent bet to repeat a 20-homer season, but forecasting 25-plus is tough to do.
Coming off of a breakout 2015 season in which he slashed a hearty .331/.370/.539 between High-A and Double-A, Mancini entered the 2016 season as one of the organization's more promising prospects. After bludgeoning Double-A pitching to the tune of seven home runs in his first 17 games, he was promoted to Triple-A. In 125 games there, the power-hitting first baseman put together an impressive campaign in which he slashed .280/.349/.427 and saw his walk rate increase to nine percent, but also his strikeout rate spike to nearly 23 percent. He joined the O's as a September callup and belted three homers in his 15 big league plate appearances. It will be interesting to see what the Orioles do with Mancini in 2017. With first base blocked by Chris Davis and the DH role likely accounted for with the return of Mark Trumbo, he could end up seeing time in left field in an effort to get his bat in the lineup. It appears to be a tall task, but if he carves out a consistent role, he is capable of providing value due to his impressive power profile.
Mancini vaulted himself to the top of Baltimore's prospect pipeline with a breakout 2015. Drafted in 2013, Mancini had not been regarded as a high level prospect. He started by repeating the High-A level and had a .213 ISO, earning a promotion to Double-A. Mancini was even better at the higher level, punching up his ISO to .227. Mancini sported a .400 BABIP at Double-A, a mark which will be difficult to sustain. With a walk rate of 5.8 percent between the two levels, he still has some work to do on plate discipline, but his 21 home runs on the season reflect power that is beginning to show up in games. Mancini appears to have surpassed Christian Walker as the top prospect at first base. Given how Mancini dominated Double-A, he seems likely to begin the season at Triple-A and he could warrant a midseason promotion unless the Orioles make a big commitment to a free agent first baseman.
More Fantasy News
Reaches three times in loss
1BChicago Cubs
May 29, 2023
Mancini went 2-for-3 with a walk, a double and a run scored in Sunday's loss to the Reds.
ANALYSIS
Subscribe now to instantly reveal our take on this news.
Losing grip on regular role
1BChicago Cubs
May 24, 2023
Mancini remains out of the lineup for Wednesday's game against the Mets.
ANALYSIS
Subscribe now to instantly reveal our take on this news.
Out of lineup Tuesday
1BChicago Cubs
May 23, 2023
Mancini is not in the lineup Tuesday against the Mets.
ANALYSIS
Subscribe now to instantly reveal our take on this news.
Sitting Sunday
1BChicago Cubs
May 21, 2023
Mancini is not in the starting lineup Sunday against the Phillies.
ANALYSIS
Subscribe now to instantly reveal our take on this news.
Serving as DH on Sunday
1BChicago Cubs
May 14, 2023
Mancini is starting at designated hitter and batting sixth in Sunday's game against the Twins.
ANALYSIS
Subscribe now to instantly reveal our take on this news.