When Clay Link co-hosted the RotoWire MLB Podcast with me last Thursday, he mentioned that he uses First-Pitch Strike Rate (F-Strike% on Fangraphs) as a helpful metric. The metric is simple enough - it's how often a pitcher starts off ahead in the count. It should be pretty obvious why this is important, but let's spell it out anyhow. According to Baseball-Reference.com, in 2018 when pitchers started the count 0-1, opposing batters hit .218/.264/.349 and pitchers had a 6.14 K/BB ratio. But when they started the count 1-0, those same batters hit .262/.379/.444, and pitchers had a 1.18 K/BB. So that seems pretty important to get off on the right foot, right? And it also follows that we might want to see who is good at getting ahead, and who struggles to do so.
Let's start out with some baselines. Across the entire MLB universe in 2018, pitchers began with an 0-1 count 55.9% of the time. But that's an overly broad sample - we're not even thinking of drafting over half the pitchers seeing action in MLB. Even in the 15-team NFBC Main Event, there are only 135 pitchers active at any given moment, plus another 50-60 more pitchers on reserve. So chances are the average F-Strike% from our pool is much higher. My hypothesis is that relievers will likely have a higher rate than starters, due to their ability to work at or near max effort. We'll test out that assumption in this exercise, but for now my focus will be on starting pitchers. The default listing on Fangraphs is to list "Qualified" starters, but in 2018 only 57 pitchers reached that threshold, and the median for those pitchers was at 62.5%, between Jakob Junis and David Price.
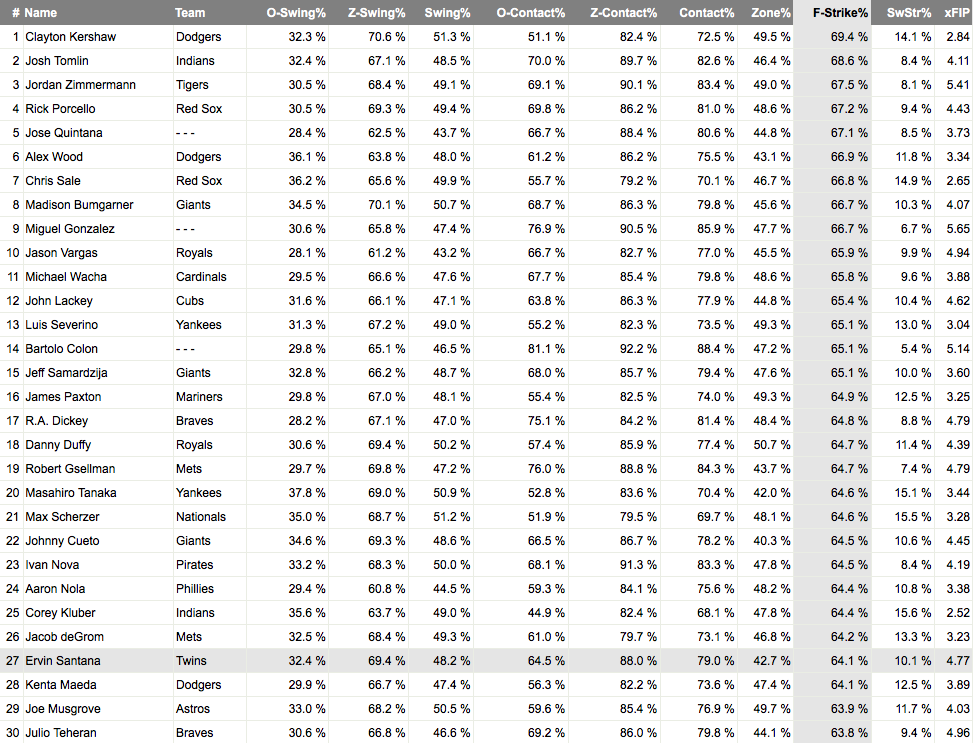
Before we expand our pool, let's look at those qualified leaders and trailers, to get an idea of who does well and who trails, once again, according to Fangraphs.
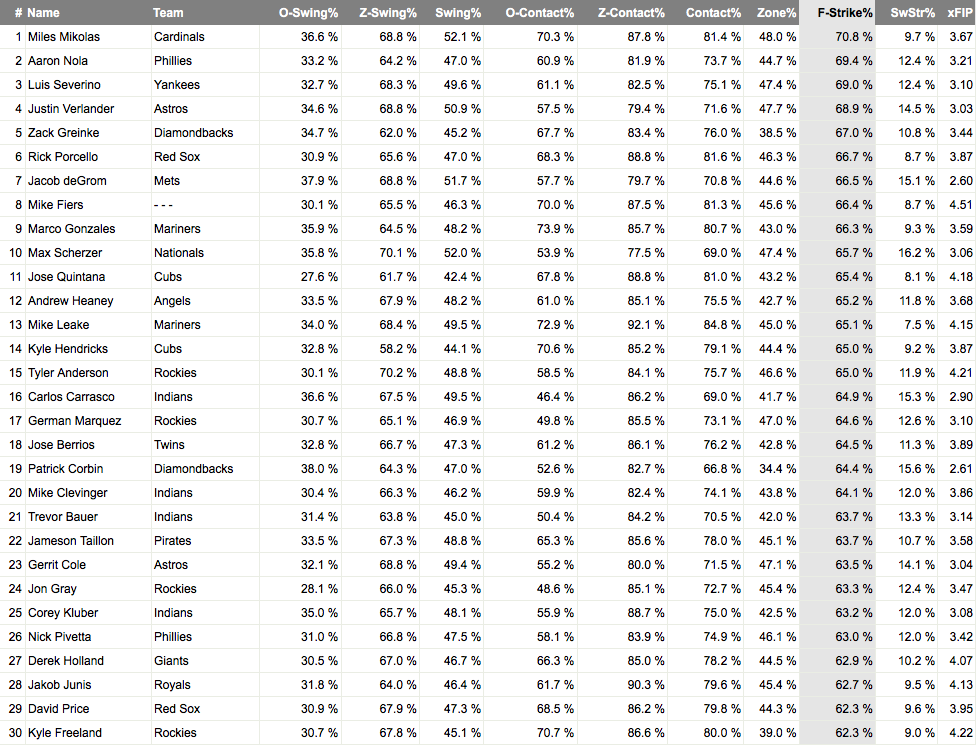
I added each pitcher's xFIP ERA to my query to get an idea how well the results correlated with overall performance. If you prefer to use their actual ERA or some other measure, I won't fight you. This is more of an introductory look, and as such I won't quibble over which stat best reflects overall performance. As alluded, this group vastly outperforms the major league baseball average, with only Lucas Giolito, Sean Newcomb and Gio Gonzalez falling below the 55.9% threshold. Also, as you might expect, the top group generally did better than the bottom group, with a few outliers in each. Of those 57 qualified starters, the median xFIP was 3.88. Of the qualified top-half of the F-Strike% group, 21 of 29 pitchers had a better than median xFIP. Of the bottom 28 in F-Strike%, only eight had an xFIP better than the 3.88 median. I'll let the more statistically-inclined precisely define the correlation, but I'm persuaded there's a pretty good relationship here.
Many of the names in the top-half of F-Strike% performers are your usual suspects, that should come as no surprise. Typically they are high strikeout pitchers with high SwStr%'s to boot. A select few are able to overcome their lack of swing-and-miss stuff by having pinpoint control - that's certainly where Miles Mikolas falls on this scale. Others still struggled despite pounding the strike zone, notably Mike Fiers (4.51 xFIP - though his xFIP with Oakland is a full run lower than it was with Detroit) and Jose Quintana (4.18). In most of these cases, the pitchers that had a high F-Strike but a poor xFIP also had trouble missing bats. Fiers had a 8.7 SwStr%, Quintana 8.1%.
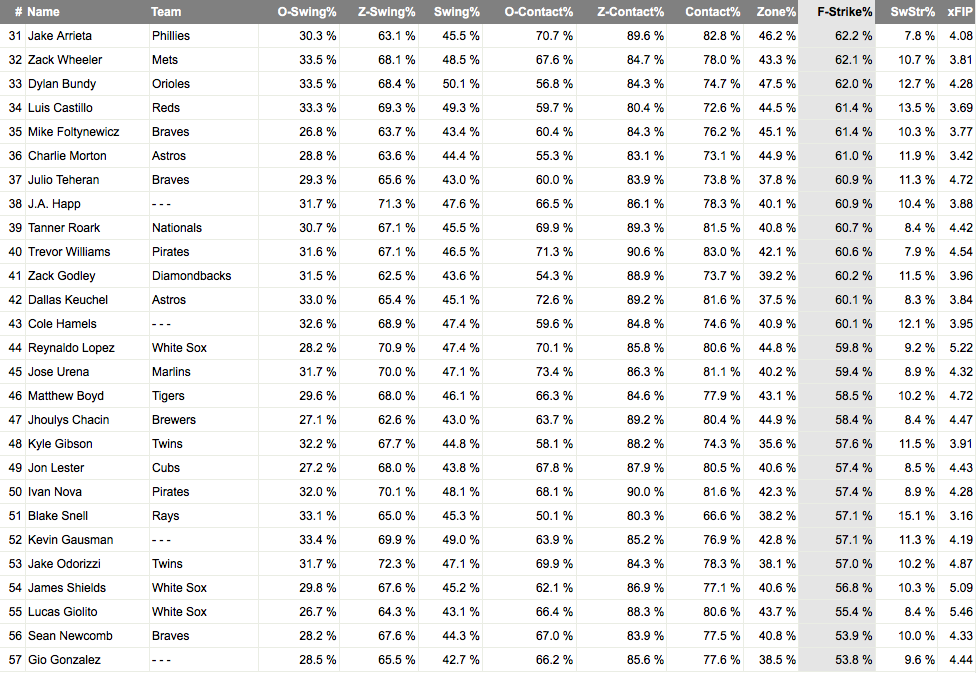
What about the other side of the coin? Who are the pitchers that succeeded despite lower F-Strike%'s? One name screams off the page:

I'm not sure what to do with this information. Does Snell get away with not jumping ahead in the count as often as his peers because his stuff is so good? Or was he still lucky even by using a measure like xFIP, that's supposed to filter out some of the luck? I think it's the former - that 15.1% SwStr% is truly elite. Remember how batters starting off with a 1-0 count hit .262/.379/.444 against the MLB universe? Against Snell in the same count, they hit .210/.337/.398. But I would also bet that opposing hitters will have a better game plan against him this year, to force him to throw strike one more often - because it was death to hitters who started off 0-1, as they hit .143/.183/.223 against him.
A few other starters with below-median F-Strike%'s but above-median xFIP's include Charlie Morton (3.42), Luis Castillo (3.69), Mike Foltnewicz (3.77) and Zach Wheeler (3.81). Both Castillo and Wheeler had far better second-halves to their season, for what it's worth.
I wanted a broader sample, as 57 pitchers is far too small, especially with so many elite pitchers not making the cut, so I lowered the minimum innings requirement to 100 IP. That will still exclude relievers while bringing in a lot more starters and hopefully bring in some names that we might not think of otherwise. By lowering the threshold, our pool has now been expanded to 140 pitchers and includes the likes of Clayton Kershaw, Chris Sale and many other mainstays that didn't reach qualified status. Our new median percentage drops ... all the way from 62.5% to 62.1%. In other words, hardly at all. I was a little surprised by that. That's almost single-handedly accomplished by pitcher #140, Tyler Chatwood, who threw a first-pitch strike half the time. His 50.0% rate clocks in well below the next lowest rate, Francisco Liriano's 53.6%. I'll screenshot the top 25 and bottom 25, click through to see the full list of 140 pitchers.
Your top 25 with the expanded list:
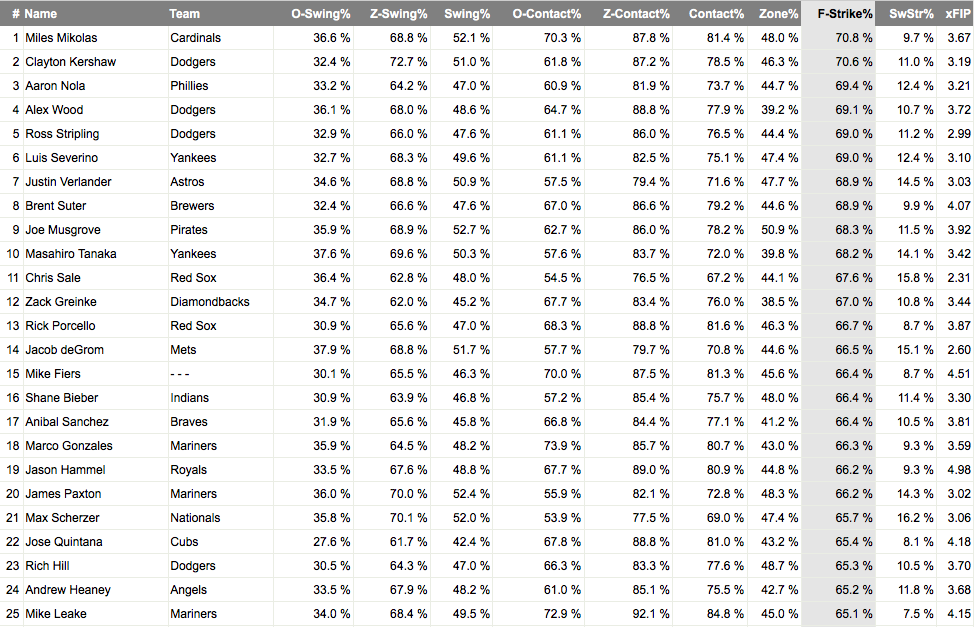
Look at all those Dodgers - four of the top 25, though Wood will now pitch in Cincinnati this year, where putting the ball in play is more punitive, so perhaps he'll work out of the zone more as a result. But this has definitely made me more bullish on Stripling - his role isn't guaranteed, but that's also what's keeping his price so low (current ADP: 226). I need to add some shares of him, to be sure. I'm also more interested in Joe Musgrove (ADP: 217.69) as a result - I really like his F-Strike% progression over the last three years - he's gone from 61.7%, to 63.9%, to 68.3% last year.
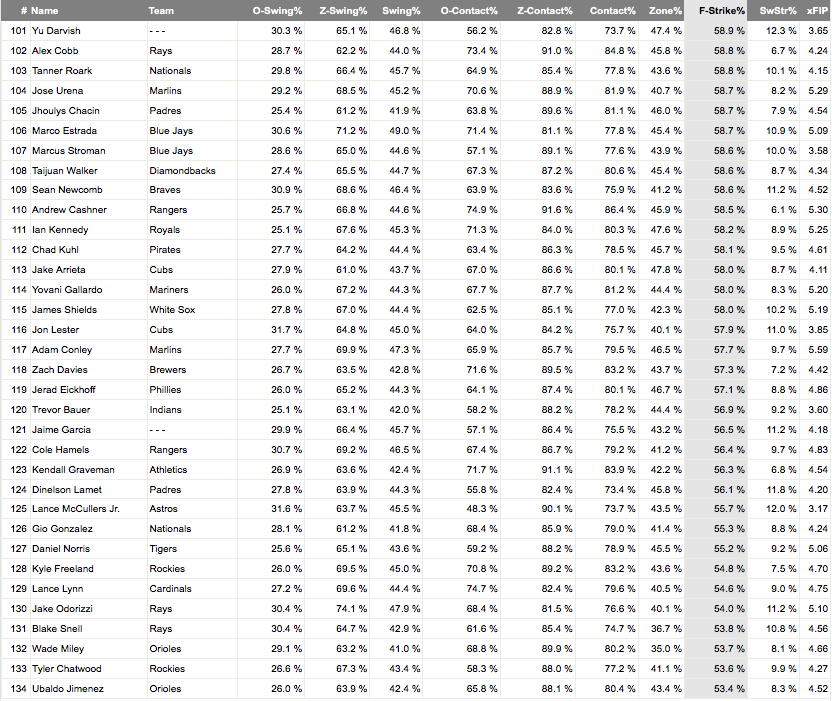
And the bottom 25:
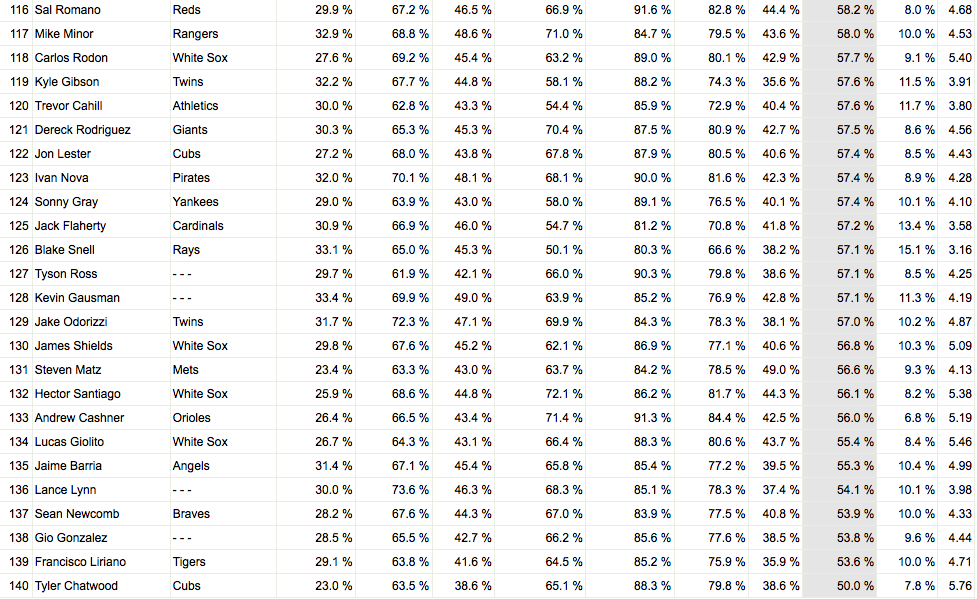
Whoa. That's a pretty ugly list. But it's worth noting that by expanding our pool, our median xFIP dropped from 3.88 to 4.13, a bigger drop than I anticipated, especially because I ran that query after the change in the F-Strike% leader list. As with our previous list of trailers, one name caught my eye:

As with Snell, Flaherty misses bats at an elite level, with a 13.4% SwStr%, which goes a long way to overcoming his control issues on the first pitch. When opposing batters started off 1-0 against him, they hit .184/.342/.301 - also like Snell, they had a hard time making good contact against him even with an advantageous count. He wasn't as deadly as Snell when he jumped ahead 0-1 - .204/.255/.366. Flaherty also faded in September - I wonder if a second full season in the rotation will help him both in terms of getting ahead in the count more often, and staying strong throughout the season.
Overall, I think I'm going to use this metric more to help avoid pitfalls than I will to identify sleepers. The biggest red flag on this list for me belongs to Sean Newcomb - a well-below 53.9% F-Strike%, 4.33 xFIP and only a 10.0% SwStr% makes me want to run away, especially when he's virtually the same price as Musgrove and Stripling (ADP: 209.96).
What about repeatability? After all, a metric is only useful if there's some consistency to it. If a pitcher varies wildly in F-Strike% from year-to-year, then it can hardly be predictive in nature. Perhaps with younger pitchers we can expect a level of improvement that allays our fears, as in the case of Musgrove? Looking at 2017's numbers, you can find a little confirmation in favor of using this metric, but also some concerns.
Oh, hi, Josh Tomlin and Jordan Zimmermann. They're not exactly the guys you want to see listed second and third in the category when you're trying to find a useful metric. There's some good news here, though - notice the correlation between the high xFIP and the low SwStr%. These guys are pounding the strike zone but not making anyone miss - seems like a pretty bad formula to me. Those generating a lot of whiffs are doing just fine. Also, there's Jose Quintana again - maybe I should have seen his regression coming!
How about the trailers on this list? Could we have detected a few disasters knowing their F-Strike% in conjunction with their xFIP and/or their SwStr%?
This list actually disturbs me some. Sure, I wouldn't have touched Tyler Chatwood or Lance Lynn (I had *way* too many shares of Lynn last year, thinking he'd be better a year removed from his comeback from Tommy John surgery), and that would have saved me some pain. But I also might not have gone after Trevor Bauer as much as I did, seeing his 9.2% SwStr% in conjunction with the low first pitch strike rate. And if I had any notion about investing in Kyle Freeland, this would have sworn me off of him too. Moreover, there's Blake Snell again - at least he still had a good SwStr%.
Going through this exercise, I tend to believe that looking at First Pitch Strike % is much like looking at other metrics. Helpful in some instances, but maybe more limited than I would have liked, at least as a stand-alone stat. It works much better tied with other metrics - and I'm more than willing to concede I'm not tying it with the right complimentary metrics. I'm trying to improve my statistical chops - both at identifying useful metrics, and also in calculating their utility. If you've used this before, I'd like to hear about your experiences. Was it helpful? How is it best used? Did it help you identify an interesting pitcher last year? Let me know.