
DraftKings’ Thursday NHL picks include value play Drake Batherson, who has compiled five goals, six helpers and 14 shots over a five-game point streak.
Claim the SpinBlitz sweepstakes casino welcome bonus with promo code ROTO: Receive up to 57,500 Gold Coins, 12.5 free Sweeps Coins, and 30 free SC spins.

Bettors can wager on Las Vegas at Denver to get up to $1,500 in bonus bets with BetMGM using our exclusive code ROTOSPORTS.
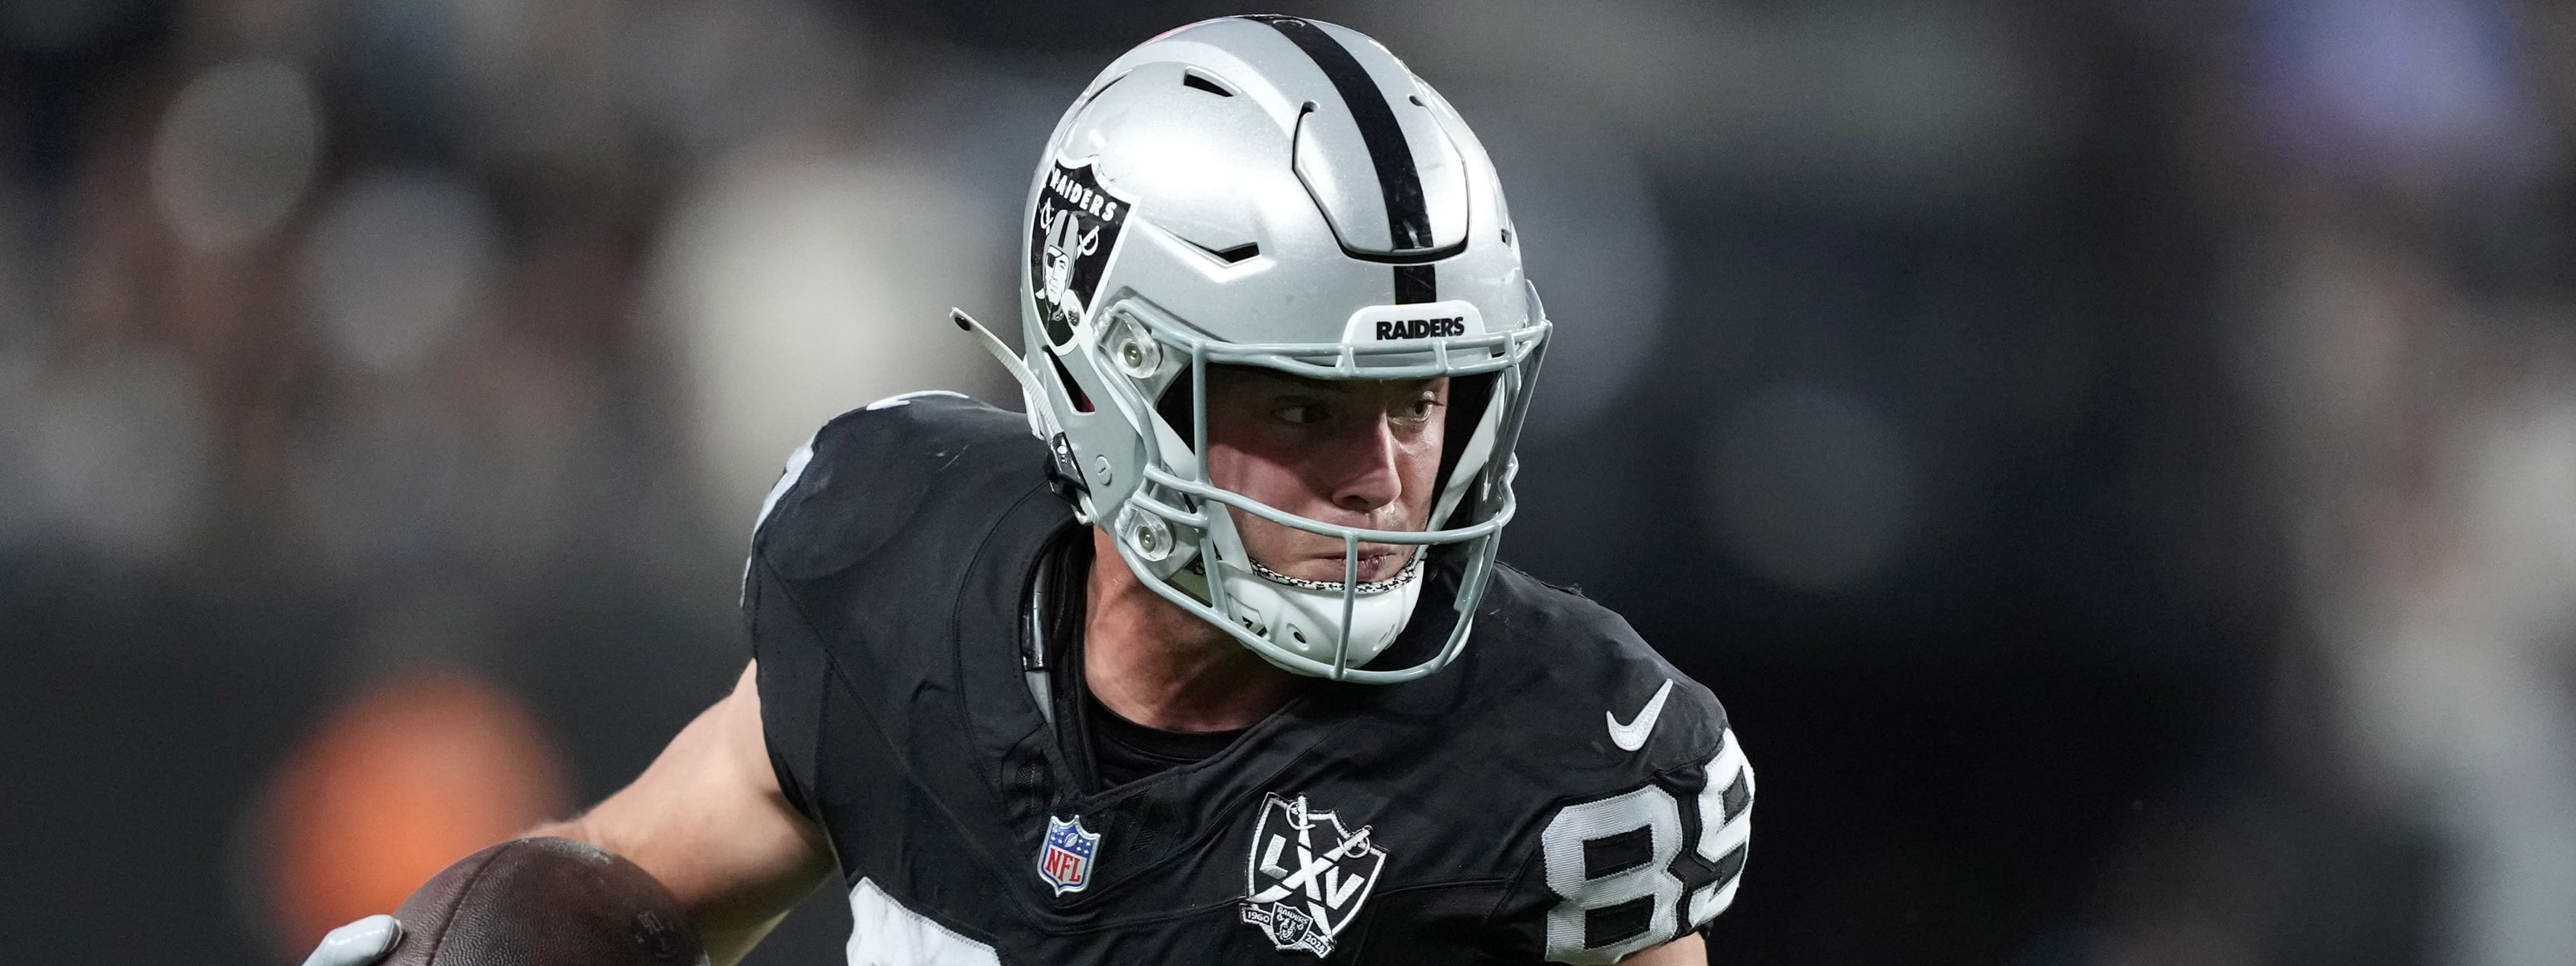
Brock Bowers is finally proving the preseason hype, and RotoWire's Mike Barner is expecting more production Thursday night against Denver.

FanDuel’s Wednesday night NHL DFS picks highlight Mikhail Sergachev, who has rebounded of late by recording two goals and 10 points across his past seven games.

Find the best FPL Free Hit team for Gameweek 11. Expert analysis of top picks, captain choices and low-rostership differentials to boost your rank.

Justin Herbert has been excellent this season, but Joe Bartel has concerns the Pro Bowl quarterback could face an uphill battle against a reinvigorated Pittsburgh pass rush this week.
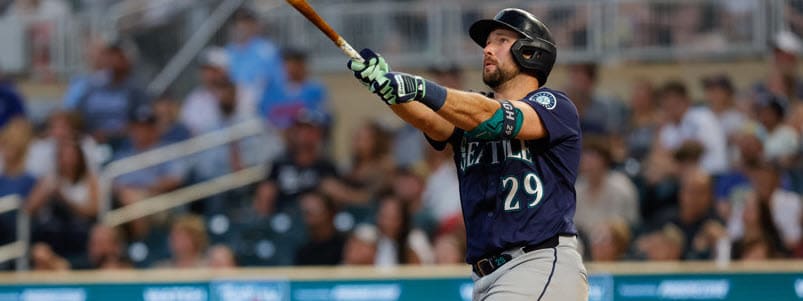
This week's leaderboard takes a look at pulled air rate, a stat which Cal Raleigh led by a wide margin last season.
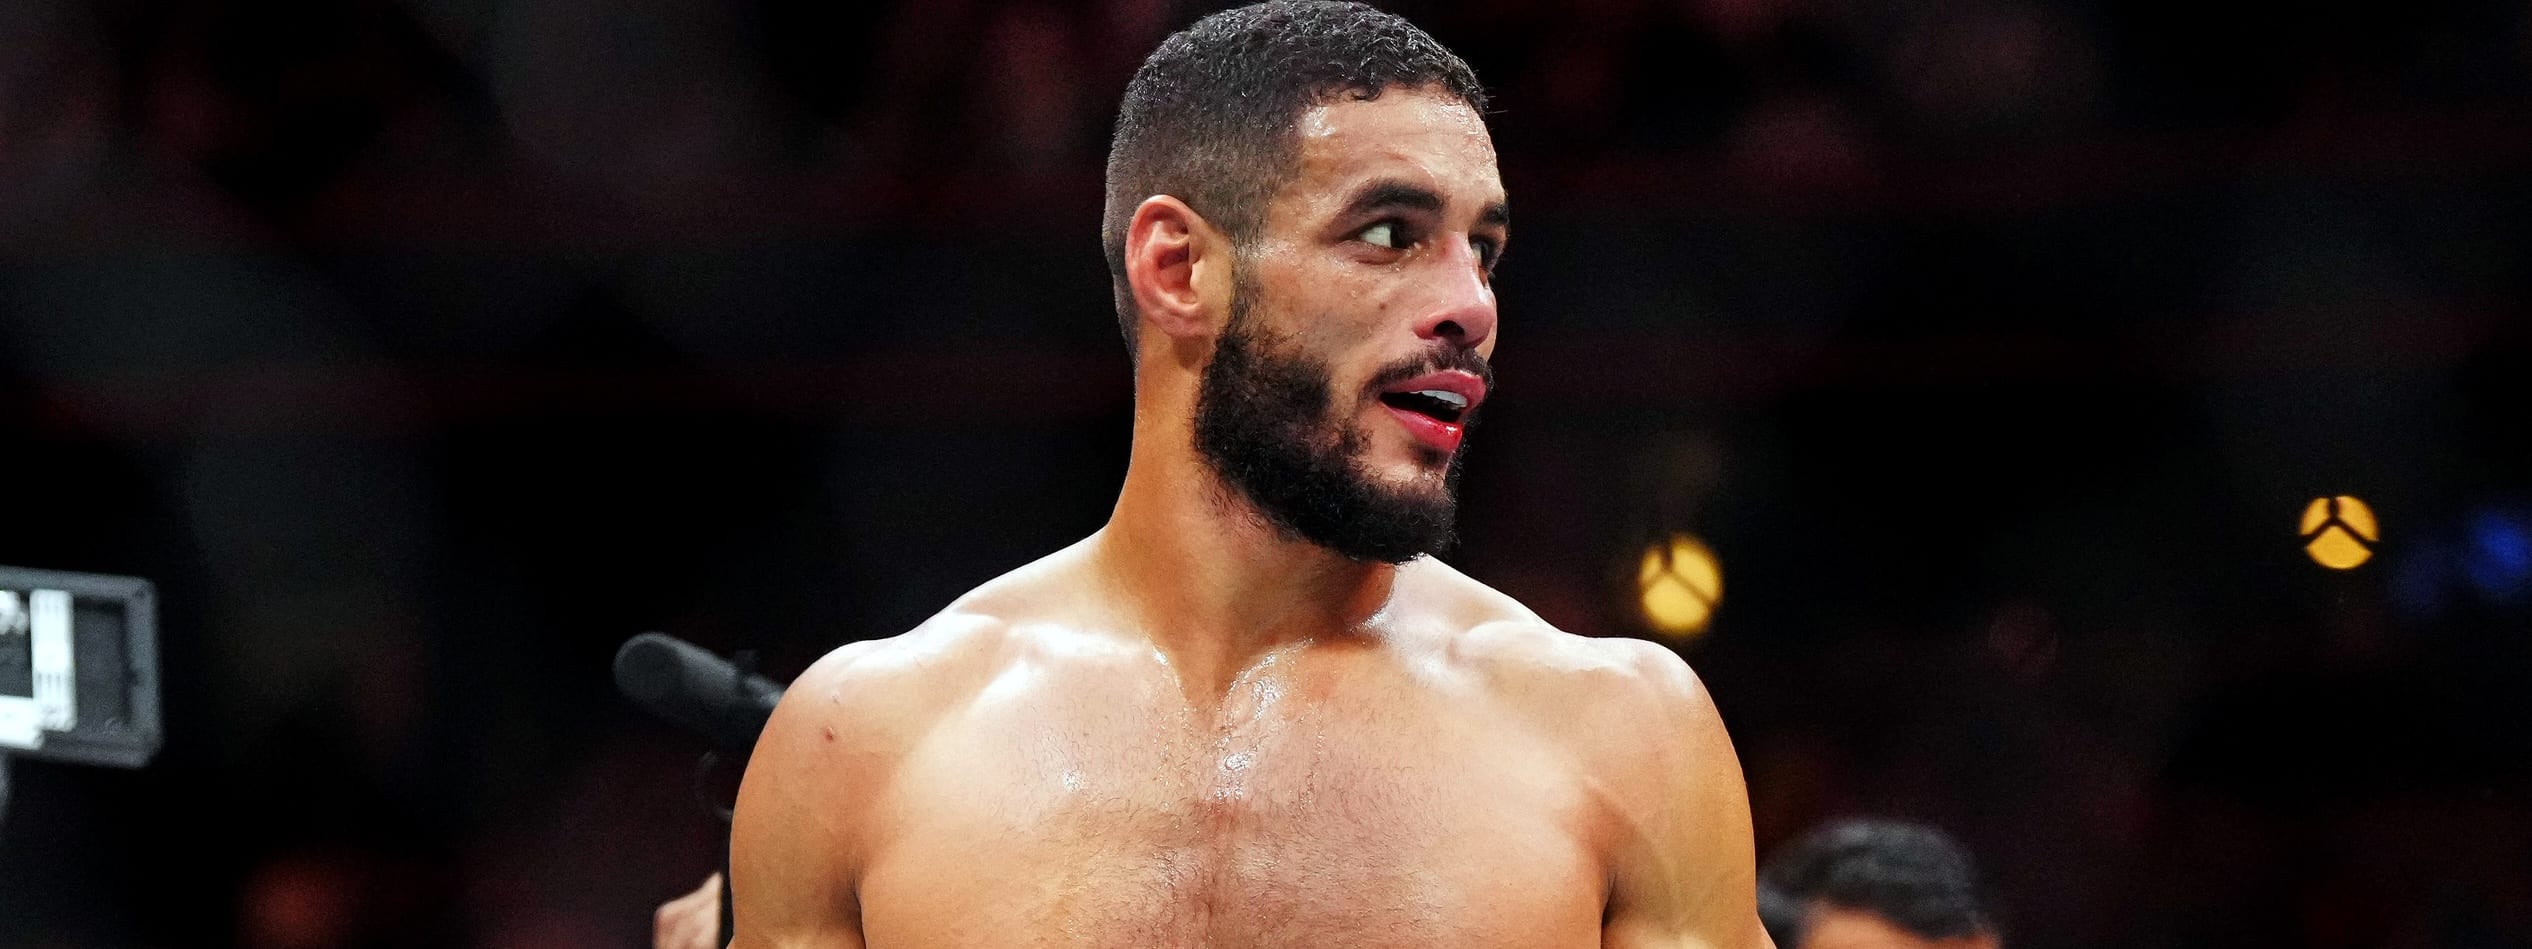
The top UFC betting and DFS plays for this weekend's UFC Vegas 111 card are up, as well as breakdowns of betting and lineup strategy, plus predictions for the entire event.
Advanced stats and usage trends from Week 9 can help fantasy managers optimize lineups for Week 10 and beyond.
Get the best NBA betting promos and bonuses for all of the basketball action! Learn about exclusive NBA betting promo codes and how to claim them.

Maximize your NBA DFS success—discover standout DraftKings plays, injury insights, and matchup-based picks for Wednesday’s 8-game slate.

Free NBA picks & player props for Wednesday, Nov 5. Tools, odds, injury updates, and more to beat the lines. Click for expert insights now!

Find the top Underdog Fantasy plays for College Football Week 11 games, including the top pick for Saturday night's top-25 matchup in Iowa City.

While sports betting isn't legal just yet in the Golden State, you can find the best legal California sportsbooks that you can bet with right now!

You can get a 3-mont subscription to NBA League Pass by signing up with our exclusive link. Learn about how to claim the NBA League Pass promo code today!

Discover NHL Pick’Em plays you can trust, including top prop bets like Anthony Stolarz saves, Morgan Frost power-play points & Kurashev shots to win big.

With Walker Kessler out for the season, Jusuf Nurkic becomes the top fantasy basketball waiver wire pickup. Analysis of his value, recent stats, and backup options for deep leagues.