
You can get up to $2000 in FanCash over your first 10 days of using the Fanatics Sportsbook promo. Learn how to claim $2000 for Indianapolis Colts vs. Pittsburgh Steelers

College basketball picks on PrizePicks for the opening night of the 2025 season are discussed, featuring DFS strategy and insight for pick'em games.
Earn $150 in bonus bets if your NFL Week 9 bet wins after using the Hard Rock Bet promo. Sign up and earn the bonus today!

The bet365 refer a friend bonus ROTOWIRE gets you up to $500 in bonus bets annually, just by referring new friends. Check out our complete breakdown of the bet365 referral bonus here.

Earn $300 in bonus bets if your Kansas City Chiefs vs. Buffalo Bills bet wins after using the FanDuel promo code. Find out about this sign-up bonus today!
You can get $300 in bonus bets if your first bet wins by using the DraftKings promo code on NFL Week 9 Sunday games today!

You can get $200 in bonus bets instantly by using the bet365 bonus code on Seahawks at Commanders today!

Get the best NFL betting promos and bonuses for Week 8 of NFL action! Learn about exclusive NFL sportsbook promo codes and how to claim them.

You can get a 100% deposit match up to $500 with the Bleacher Nation Fantasy promo code ROTO. Learn more about the BN Fantasy promo code here.

Claim $50 in bonus picks when you sign up and register right now using the exclusive DraftKings Pick 6 promo. Claim the DraftKings Pick 6 promo for today's NFL games & more.
Unlock $60 in bonus entries when you sign up and register right now using the FanDuel Picks promo code. Claim the FanDuel Picks promo for the NFL, NBA & more.

You can get $50 in Novig Cash just by spending $5 in prediction markets with the Novig promo code ROTOWIRE. Learn more about the Novig promo here.

While sports betting isn't legal just yet in the Golden State, you can find the best legal California sportsbooks that you can bet with right now!

You can play sweepstake casino real money games at RealPrize, CrownCoins & McLuck. Enjoy free slots, win real prizes, and join legally from almost anywhere in the U.S.
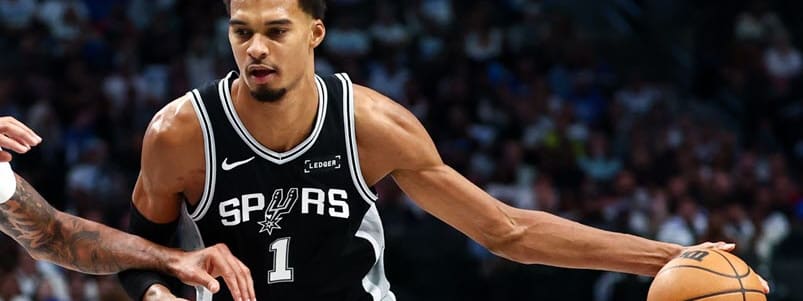
RotoWire's JP Aravena provides his free NBA picks and props for Sunday's eight-game slate, including a lean on Victor Wembanyama.

Sunday's DraftKings NBA DFS seven-game slate features Victor Wembanyama, Luka Doncic and Tyrese Maxey as top plays. RotoWire's Joel Bartilotta analyzes injury-driven value picks and chalk options.

Get NHL insights for Nov 3–9: rising stars, key matchups, goalie picks & player stats — your week-ahead hockey edge.
The best Pennsylvania sportsbook promos grant over $4,000 in welcome bonuses to new users. Learn more and claim the top PA sports betting promos today.