Rotisserie leagues can often be branded as boring and mundane, largely because they do not bring the intense weekly battle that can often be decided late on a Sunday night.
They are played over a full NBA fantasy season comprising of 25 weeks. Team standings in rotisserie leagues can regularly get lost in the scheme of a whole season without weekly competition and comparison. Furthermore, the standings are usually skewed due to the number of games each team has played, and this can often complicate the process of knowing where your team stands overall.
Because rotisserie leagues rank fantasy teams based on their season-long production, both the short- and long-term performance of your team, needs to be accounted for. In competitive leagues, a whole fantasy season could come down to the final weeks, days, or perhaps games, to determine the overall winner.
This is why it's important to maintain a clear understanding of how not only your team, but every team in your league, is performing throughout the season.
Let's go over how this can be done.
For the purpose of this article, I will focus on a 12-team, 8-category league. You can tailor this strategy for any league settings though.
At any point of the season, enter into a spreadsheet each team and their total in every counting category (as below):
| GP | 3PTM | REB | AST | STL | BLK | PTS | |
|---|---|---|---|---|---|---|---|
| Team 1 | 134 | 151 | 726 | 523 | 155 | 87 | 1992 |
| Team 2 | 141 | 101 | 851 | 398 | 157 | 126 | 1983 |
| Team 3 | 137 | 151 | 860 | 427 | 110 | 66 | 1990 |
| Team 4 | 140 | 146 | 672 | 550 | 163 | 73 | 2089 |
| Team 5 | 123 | 140 | 641 | 351 | 101 | 91 | 1700 |
| Team 6 | 134 | 142 | 728 | 375 | 134 | 76 | 2014 |
| Team 7 | 118 | 104 | 684 | 426 | 131 | 84 | 1999 |
| Team 8 | 125 | 107 | 764 | 387 | 106 | 112 | 1957 |
| Team 9 | 120 | 115 | 729 | 391 | 110 | 72 | 1746 |
| Team 10 | 127 | 97 | 629 | 354 | 113 | 87 | 1469 |
| Team 11 | 132 | 115 | 846 | 334 | 104 | 73 | 1728 |
| Team 12 | 119 | 117 | 724 | 368 | 107 | 83 | 1642 |
To achieve a pure understanding of how each team in your league is performing, we need to find a level playing field. To do this, we divide the total of each team's categories, by the number of games played. This will give you a per-game average for each category, by team:
| GP | 3PTM | REB | AST | STL | BLK | PTS | |
|---|---|---|---|---|---|---|---|
| Team 1 | 134 | 1.126 | 5.418 | 3.902 | 1.156 | 0.649 | 14.865 |
| Team 2 | 141 | 0.716 | 6.035 | 2.822 | 1.113 | 0.893 | 14.063 |
| Team 3 | 137 | 1.102 | 6.277 | 3.116 | 0.802 | 0.481 | 14.525 |
| Team 4 | 140 | 1.042 | 4.800 | 3.928 | 1.164 | 0.521 | 14.921 |
| Team 5 | 123 | 1.131 | 5.209 | 2.852 | 0.821 | 0.736 | 13.799 |
| Team 6 | 134 | 1.059 | 5.417 | 2.798 | 1.000 | 0.567 | 15.029 |
| Team 7 | 118 | 0.881 | 5.796 | 3.610 | 1.110 | 0.711 | 16.941 |
| Team 8 | 125 | 0.856 | 6.112 | 3.096 | 0.848 | 0.896 | 15.656 |
| Team 9 | 120 | 0.966 | 6.075 | 3.258 | 0.916 | 0.600 | 14.550 |
| Team 10 | 127 | 0.763 | 4.952 | 2.787 | 0.889 | 0.685 | 11.566 |
| Team 11 | 132 | 0.871 | 6.409 | 2.530 | 0.787 | 0.553 | 13.091 |
| Team 12 | 119 | 0.967 | 6.084 | 3.092 | 0.899 | 0.697 | 13.798 |
Now, we can assign the relevant point totals to each team based on the per-game average. In a 12-team league, the category leader gets 12 points, the second team gets 11 points and so on:
| GP | 3PTM | REB | AST | STL | BLK | PTS | |
|---|---|---|---|---|---|---|---|
| Team 1 | 134 | 11 | 4 | 11 | 11 | 6 | 8 |
| Team 2 | 141 | 1 | 7 | 4 | 10 | 11 | 5 |
| Team 3 | 137 | 10 | 11 | 8 | 2 | 1 | 6 |
| Team 4 | 140 | 8 | 1 | 12 | 12 | 2 | 9 |
| Team 5 | 123 | 12 | 3 | 5 | 3 | 10 | 4 |
| Team 6 | 134 | 9 | 5 | 3 | 8 | 4 | 10 |
| Team 7 | 118 | 5 | 6 | 10 | 9 | 9 | 12 |
| Team 8 | 125 | 3 | 10 | 7 | 4 | 12 | 11 |
| Team 9 | 120 | 6 | 8 | 9 | 7 | 5 | 7 |
| Team 10 | 127 | 2 | 2 | 2 | 5 | 7 | 1 |
| Team 11 | 132 | 4 | 12 | 1 | 1 | 3 | 2 |
| Team 12 | 119 | 7 | 9 | 6 | 6 | 8 | 3 |
Once this is complete, we can add up each team's points. I like to total the counting stats separately to the percentage categories to begin with, as they are a pure per-game representation, and give you a true understanding of the progress of your team. After that, I add in the percentage category points for an overall total (OT):
| GP | 3PTM | REB | AST | STL | BLK | PTS | TOTAL | FG% | FT% | OT | |
|---|---|---|---|---|---|---|---|---|---|---|---|
| Team 1 | 134 | 11 | 4 | 11 | 11 | 6 | 8 | 51 | 7 | 11 | 69 |
| Team 2 | 141 | 1 | 7 | 4 | 10 | 11 | 5 | 38 | 9 | 2 | 49 |
| Team 3 | 137 | 10 | 11 | 8 | 2 | 1 | 6 | 38 | 5 | 8 | 51 |
| Team 4 | 140 | 8 | 1 | 12 | 12 | 2 | 9 | 44 | 3 | 4 | 51 |
| Team 5 | 123 | 12 | 3 | 5 | 3 | 10 | 4 | 37 | 10 | 12 | 59 |
| Team 6 | 134 | 9 | 5 | 3 | 8 | 4 | 10 | 39 | 2 | 7 | 48 |
| Team 7 | 118 | 5 | 6 | 10 | 9 | 9 | 12 | 51 | 12 | 1 | 64 |
| Team 8 | 125 | 3 | 10 | 7 | 4 | 12 | 11 | 47 | 1 | 10 | 58 |
| Team 9 | 120 | 6 | 8 | 9 | 7 | 5 | 7 | 42 | 6 | 3 | 51 |
| Team 10 | 127 | 2 | 2 | 2 | 5 | 7 | 1 | 19 | 11 | 9 | 39 |
| Team 11 | 132 | 4 | 12 | 1 | 1 | 3 | 2 | 23 | 8 | 5 | 36 |
| Team 12 | 119 | 7 | 9 | 6 | 6 | 8 | 3 | 39 | 4 | 6 | 49 |
Now, our adjusted per-game rankings look like this:
| Rank | OT |
|---|---|
| Team 1 | 69 |
| Team 7 | 64 |
| Team 5 | 59 |
| Team 8 | 58 |
| Team 4 | 51 |
| Team 3 | 51 |
| Team 9 | 51 |
| Team 2 | 49 |
| Team 12 | 49 |
| Team 6 | 48 |
| Team 10 | 39 |
| Team 11 | 36 |
I will generally do this three times over the course of a season. Usually, I'll perform this audit after NBA teams have played around 20, 40 and 60 games. Not only does this evenly divide the season, but it provides enough of a sample size to see the changes over time.
The information now clearly shows us how each team is tracking based on their per-game averages. We can also use this information to gain a better understanding of our strengths and weaknesses, so we can plan accordingly.
I will outline a few of the key points and tactics that this information provides:
Our team positives and negatives: For the sake of the exercise, our team will be Team 4. On a positive note, our team is leading in both steals and assists, marginally ahead of Team 1 in both categories. Although we are first now, these categories will still need attention throughout the season. We could easily drop two points with careless planning or transactions.
Negatively, our team is very poor in rebounds and blocks. We are averaging 4.8 rebounds per game, so we can catch Team 10 who has 4.9 rebounds with some work. To make up significant points though, we will need to average 5.5 rebounds per game by the end of the season, to finish mid table in that category.
If we can increase our lead in assists and steals over the course of the season, then we can trade for some rebounds, blocks and field goal percentage when we deem our lead is unassailable.
Our overall competitors: If we look at the points in the percentage categories we have a combined total of seven points (three points for field goal percentage + four points for free throw percentage). Our team ranks last across these two categories, so that will need to be a high priority throughout the season to make up ground. At this point, it doesn't matter how strong your team is in counting statistics, if you are weak in even one percentage category, it will be very difficult to win your league.
We have already identified that we are lacking rebounds and blocks. Team 1 is mid table in both these categories (currently with 4 points and 6 points). So not only do we know we need to make up points here anyway, but if we can catch Team 1, we can pinch some valuable points off of them too.
Trading: Trading in rotisserie leagues can be two fold. You can benefit your team and the teams around you, but you can also trade to negate your main competitors. Team 5 is ahead of us at this point of the season, and they are the league leader in three-pointers made.
By trying to trade for a decent three-point shooter from them, it will make our team stronger, and their team weaker. The difference between 1.102 threes per game and 1.131 threes per game is minimal at this point of the season. There are five teams that all average over one three per game, so this category is very close and can cause a huge shift in the overall rankings. If Team 5 drops four points and we gain four points, all of a sudden our teams are equal.
This analysis and approach to the standings should be done with each category. Be diligent when you work through these per-game averages, and you will find trading and adding players much easier as you focus on your target areas. The further into the season you get the more difficult it will be to make up large ground, potentially in multiple categories.
If there is a whole point between your team and the team above and below, then you will not make up or lose ground. At that point, it may be worth trading some scoring to gain a point or two in another category.
The same can be said for percentages; towards the back end of the season, if you are a whole percent in front or behind another team then things should remain status quo. It may be worth trading away an efficient shooter (in either category) to gain points elsewhere.
Maximising schedule and games played: If you are significantly behind in games played, there are two main ways to catch up. Firstly, you can stream through one of your roster slots. Streaming is dropping and adding players regularly, to not only maximize games played, but increase statistics in one or more categories. Use the data that is in your tables, and stream guys who will help you the most in a desired category.
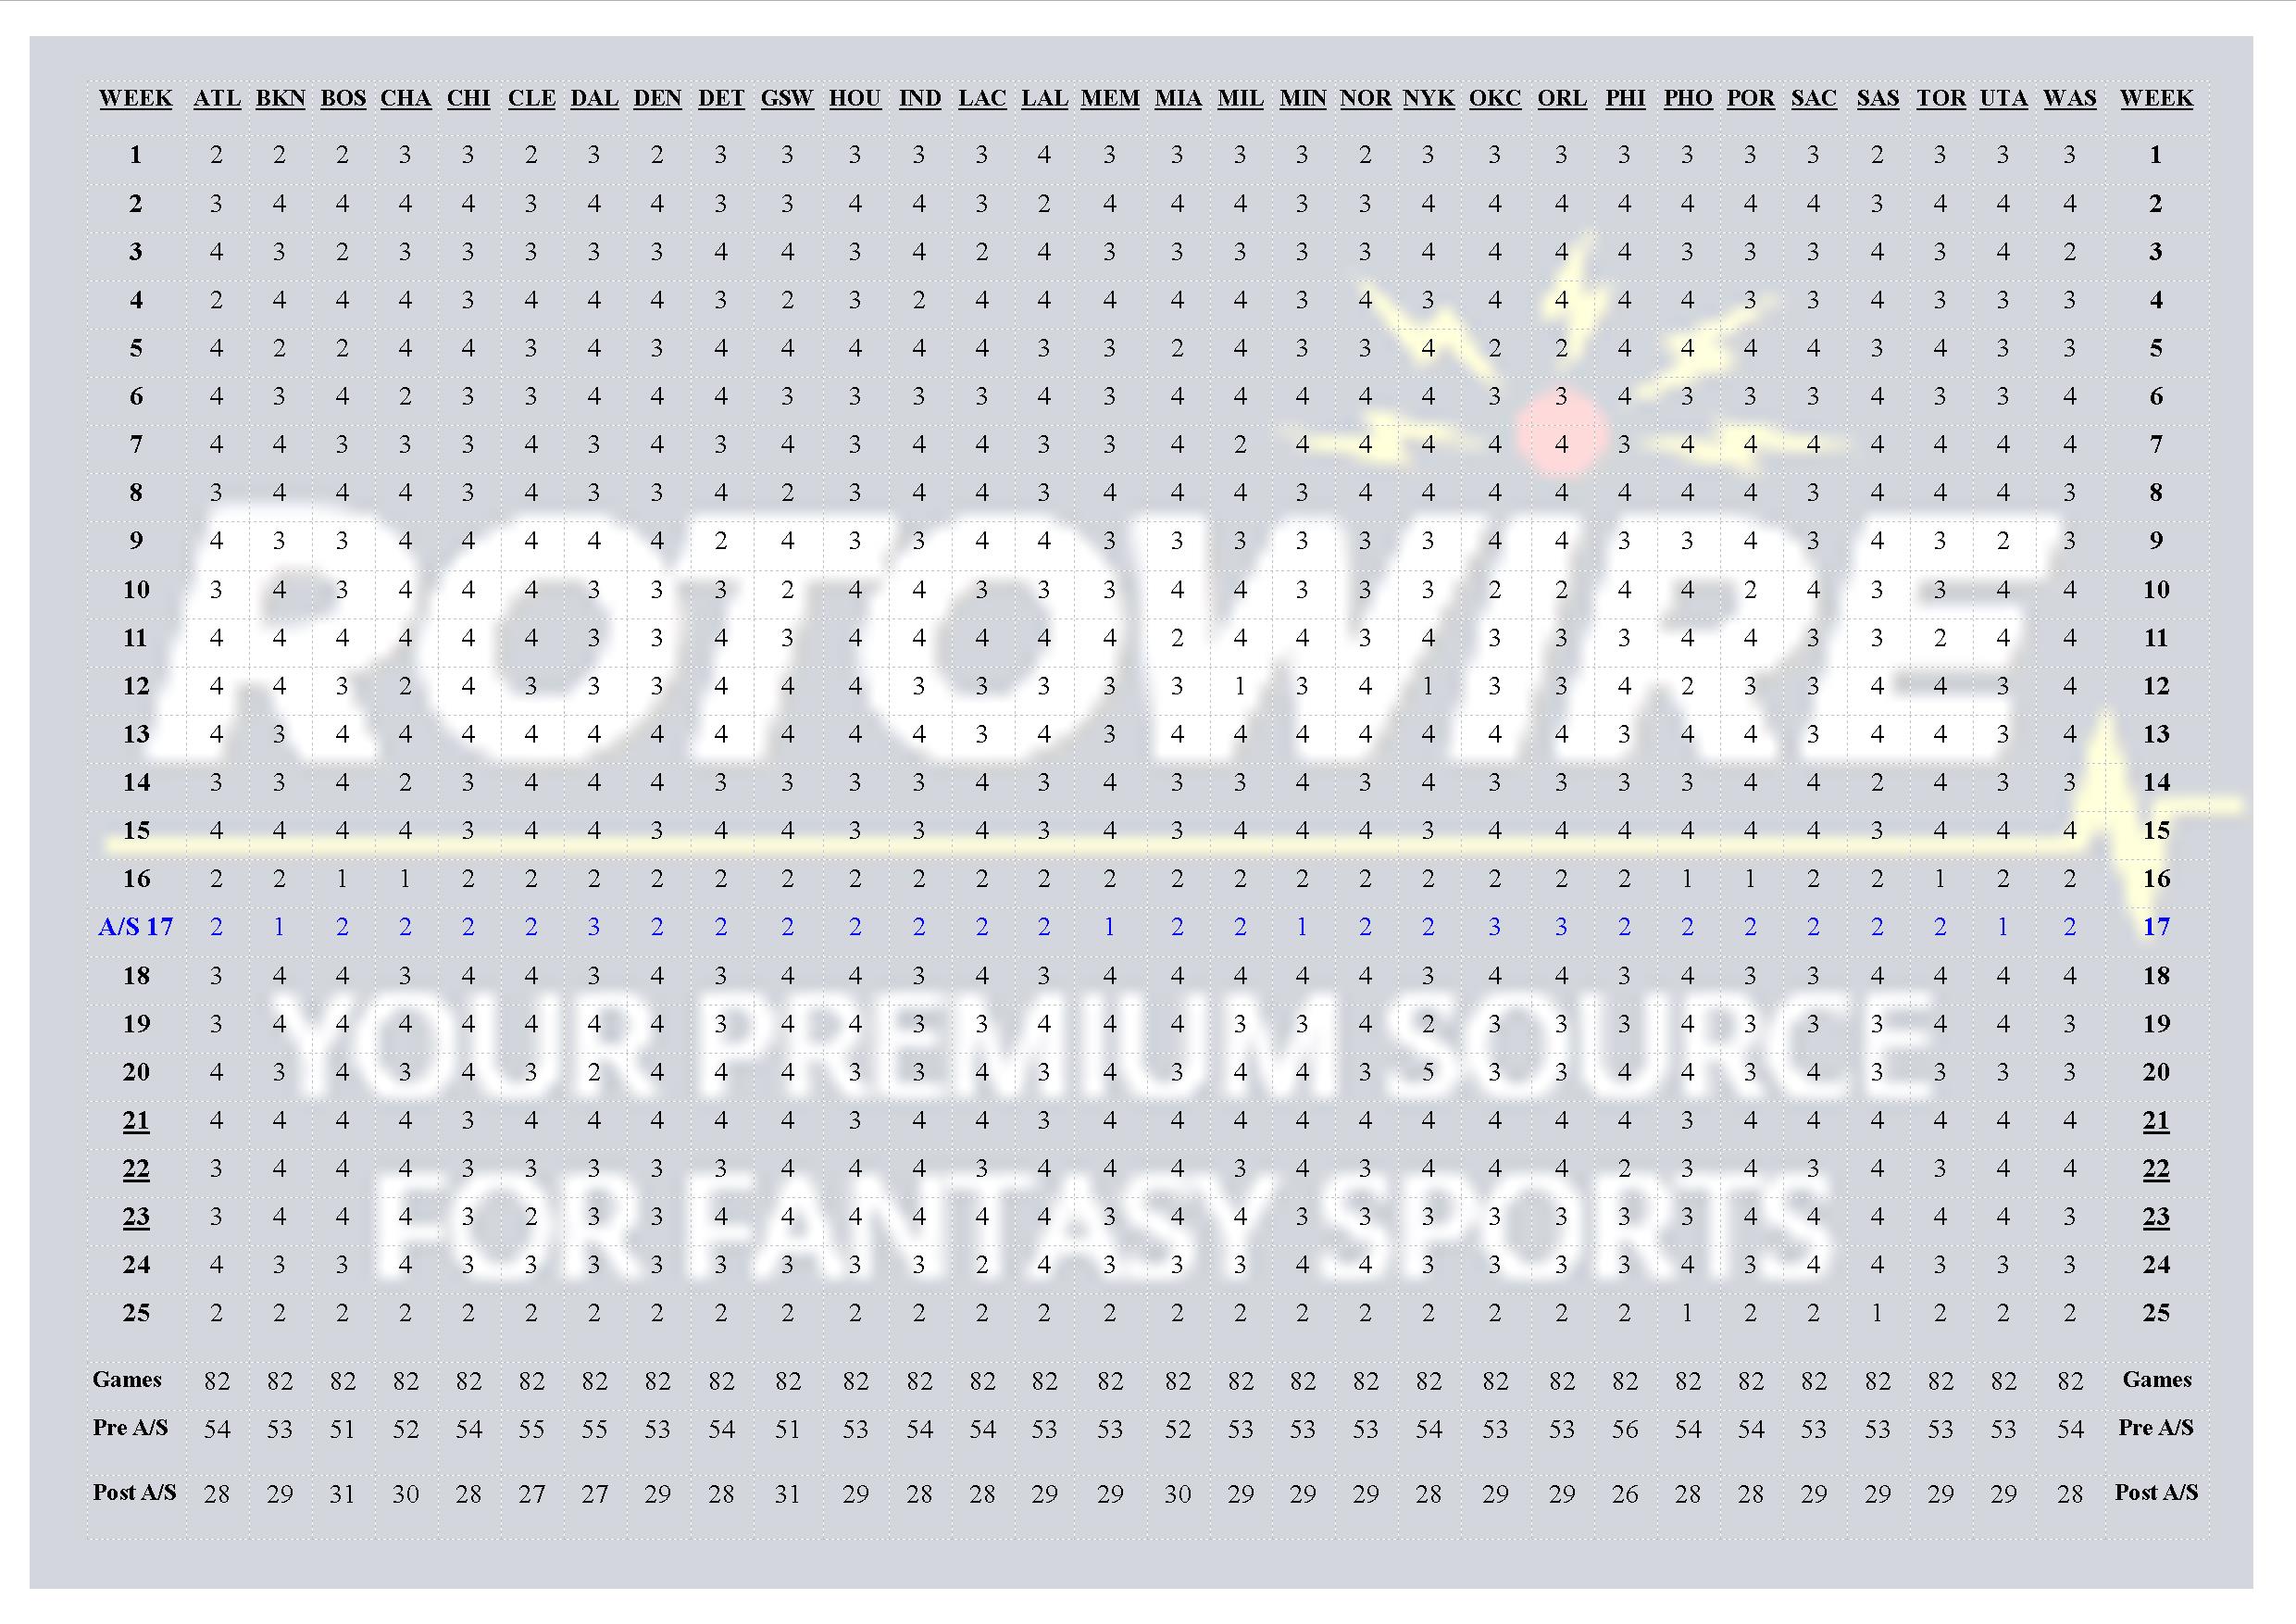
Secondly, you can use a schedule grid (see below for one I prepared earlier) to see which teams play more games over a certain time span (or the rest of the season) and pick-up or trade for their players accordingly. For instance, the Golden State Warriors play the most games after the All Star break with 31. I'm not saying break the bank and acquire Steph Curry, but it may be worth sussing out guys like Klay Thompson, David Lee, Draymond Green or Harrison Barnes if they also fulfil a need.
I hope you found this article interesting and informative. If you have any questions, please send me a question on twitter @SmanSports.