




In writing this According to the Data column, my primary goal is to use statistics to help you make predictions. Whether projecting players or creating a big board, the ultimate goal is to forecast the future as accurately as possible.
We have to be very careful about the numbers in which we place our confidence, however. Namely, we want to separate explanatory stats from predictive stats. An explanatory stat can do a really good job of explaining why a past event happened the way it did. But for a stat to be useful to us, it needs to be predictive; it must aid us in accurately predicting the future in some way.
An example of the difference between an explanatory stat and a predictive stat is fumble recoveries versus yards per passing attempt. If a defense secures a handful of fumble recoveries in a victory, that's probably a really big reason that team won. But it's not particularly useful to us because fumble recoveries can't predict future wins. It's just too volatile of a statistic. YPA, on the other hand, has an uncanny ability to predict future winners. It's a predictive stat - one that possesses pragmatic value.
Ultimately, we need to be judging the consistency of a stat from game to game and from year to year. If the stat isn't consistent, it really has no value to us (in the same way that kickers aren't valuable because they have zero year-to-year consistency).
Strength of Schedule
When the guys here at RotoWire asked me to do a strength of schedule analysis, the first thing I needed to do was figure out if defensive play is consistent. If team defense carries over from year to year, then maybe analyzing opponent strength isn't such a bad idea. So I tracked the 2010, 2011, and 2012 ranks for each team in terms of pass defense, run defense, and interceptions. I sorted teams by total yards allowed because that's what matters in fantasy football; running backs get points for rushing yards, for example, not yards per carry.


| Team | 2012 Pass D | 2011 Pass D | 2010 Pass D | 2012 Run D | 2011 Run D | 2010 Run D | 2012 INT | 2011 INT | 2010 INT |
| 49ers | 4 | 16 | 24 | 4 | 1 | 6 | 16 | 2 | 17 |
| Bears | 8 | 28 | 20 | 8 | 5 | 2 | 1 | 7 | 6 |
| Bengals | 7 | 9 | 14 | 12 | 10 | 19 | 17 | 26 | 16 |
| Bills | 10 | 19 | 3 | 31 | 28 | 32 | 21 | 9 | 29 |
| Broncos | 3 | 18 | 25 | 3 | 22 | 31 | 13 | 30 | 31 |
| Browns | 25 | 2 | 18 | 19 | 30 | 27 | 12 | 28 | 9 |
| Bucs | 32 | 21 | 7 | 1 | 32 | 28 | 10 | 21 | 10 |
| Cardinals | 5 | 17 | 23 | 28 | 21 | 30 | 2 | 27 | 13 |
| Chargers | 18 | 13 | 1 | 6 | 20 | 4 | 18 | 15 | 14 |
| Chiefs | 12 | 6 | 17 | 27 | 26 | 14 | 31 | 6 | 19 |
| Colts | 21 | 15 | 13 | 29 | 29 | 25 | 20 | 31 | 30 |
| Cowboys | 19 | 23 | 26 | 22 | 7 | 12 | 32 | 19 | 7 |
| Dolphins | 27 | 25 | 8 | 13 | 3 | 7 | 28 | 16 | 28 |
| Eagles | 9 | 10 | 15 | 23 | 16 | 15 | 30 | 18 | 3 |
| Falcons | 23 | 20 | 22 | 21 | 6 | 10 | 5 | 10 | 4 |
| Giants | 28 | 29 | 10 | 25 | 19 | 8 | 3 | 8 | 15 |
| Jaguars | 22 | 8 | 28 | 30 | 9 | 22 | 22 | 14 | 24 |
| Jets | 2 | 5 | 6 | 26 | 13 | 3 | 24 | 11 | 25 |
| Lions | 14 | 22 | 16 | 16 | 23 | 24 | 25 | 5 | 21 |
| Packers | 11 | 32 | 5 | 17 | 14 | 18 | 9 | 1 | 2 |
| Panthers | 13 | 24 | 11 | 14 | 25 | 23 | 23 | 20 | 12 |
| Patriots | 29 | 31 | 30 | 9 | 17 | 11 | 6 | 3 | 1 |
| Raiders | 20 | 27 | 2 | 18 | 27 | 29 | 25 | 12 | 27 |
| Rams | 15 | 7 | 19 | 15 | 31 | 17 | 11 | 23 | 20 |
| Ravens | 17 | 4 | 21 | 20 | 2 | 5 | 19 | 17 | 8 |
| Redskins | 30 | 12 | 31 | 5 | 18 | 26 | 4 | 22 | 22 |
| Saints | 31 | 30 | 4 | 32 | 12 | 16 | 15 | 29 | 32 |
| Seahawks | 6 | 11 | 27 | 10 | 15 | 21 | 8 | 4 | 26 |
| Steelers | 1 | 1 | 12 | 2 | 8 | 1 | 27 | 24 | 5 |
| Texans | 16 | 3 | 32 | 7 | 4 | 13 | 14 | 13 | 23 |
| Titans | 26 | 14 | 29 | 24 | 24 | 20 | 7 | 25 | 11 |
| Vikings | 24 | 26 | 9 | 11 | 11 | 9 | 29 | 32 | 18 |
With those numbers charted, I looked at the year-to-year correlation for each team's pass defense, run defense and interceptions.
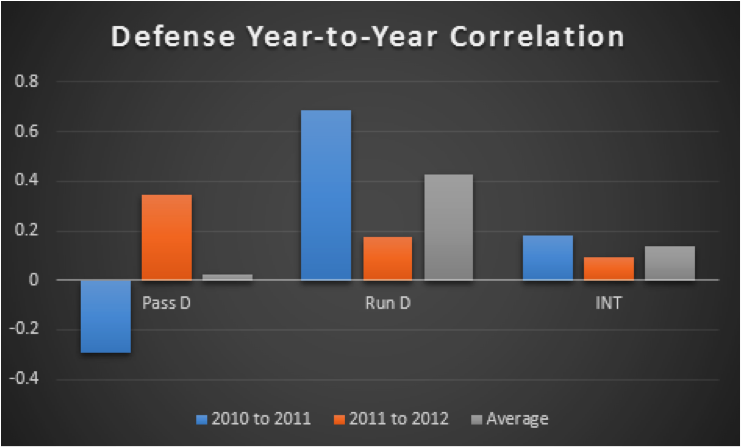
These numbers are pretty shocking. First, we see that there's been just a tiny correlation in a team's interception rank since 2010 (an average of just 0.139). On a scale of -1 to 1, that's good evidence that defensive interceptions are pretty unstable, which was to be expected.
Surprisingly, the same goes for pass defense. The correlation between pass rank in 2010 and 2011 was actually -0.295. A negative correlation indicates that the worst pass defenses from 2010 actually became the best in 2011, and vice versa. That alone suggests that pass defense isn't predictable (and thus not useful when projecting strength of schedule).
However, take a look at run defense. The average correlation coefficient since 2010 is 0.430, meaning there's a good chance that good run defenses remain good and bad ones stay bad. However, the strength of the relationship from 2011 to 2012 was only 0.174, so I figured I should do some more digging.
More on Run Defense
With data from 2010 through 2012, the question was whether or not the relatively mild run defense correlation from 2011 to last season was the norm or an outlier. After going all the way back to 2007, the results are clear.
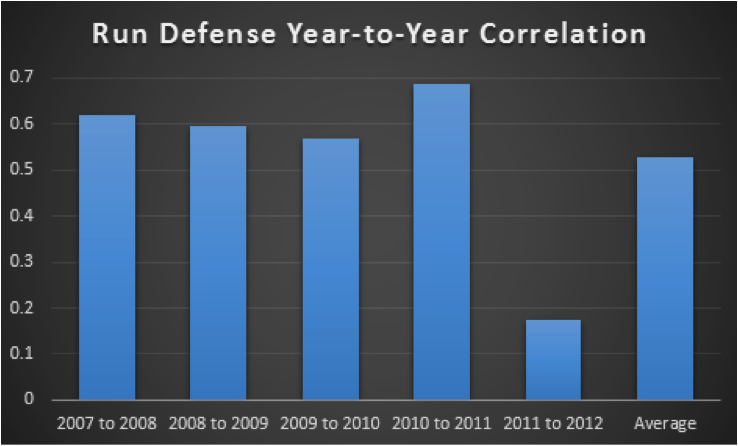
Typically, run defense is very consistent from season to season. In each of the four seasons prior to 2012, the correlation coefficient for run defense rank from the prior season was at least 0.569. That's a pretty strong effect. The average over the entire sample, even with the outlying 2011-2012 included, is 0.529.
Heading into this article, I pretty much knew that interceptions (and takeaways in general) would be pretty unstable. But why is run defense so consistent while pass defense is fluky? I think the answer is that run defense more accurately reflects actual team strength. The best teams are typically winning late in games, so their final run defense rank is usually pretty high since they don't see as many attempts. It's just the opposite for the worst teams, who see a lot of rushes attempts late in games.
You might say that we should see the same sort of effect with pass defense; if the best teams are winning and get thrown on a lot, they should give up more yards. That's true to an extent, but it's also important to remember that pass defense is more vital to team success than run defense. Many times, teams acquire leads by throwing the ball effectively and stopping the pass, then milk it away with the run. So the winning teams that get passed on a lot late in games probably didn't give up many passing yards earlier, meaning they wouldn't rank as low overall, despite the extra attempts.
To visualize the effect, let's look at how good and bad teams usually perform against the pass.
| Good Teams | Bad Teams | |
| Early in Games | Good Pass D | Bad Pass D |
| Late in Games | Bad Pass D | Good Pass D |
Because good pass defense is often the impetus for a lead that can often lead to worse pass defense (due to more attempts), the effects cancel each other out such that pass defenses—in terms of total yards—are more tightly grouped than run defenses. It's kind of like a slingshot effect; good pass defense early will result in a rebound effect caused by more attempts later, while bad pass defense will result in fewer attempts. The results converge.
On the other hand, take a look at run defense.
| Good Teams | Bad Teams | |
| Early in Games | Good or Bad Run D | Good or Bad Run D |
| Late in Games | Good Run D | Bad Run D |
Because early rushing defense doesn't matter nearly as much to a team's win probability as early pass defense, the early and late results aren't inversely correlated like we see with pass defense; a team is much more likely to stop the run early and late than they are to limit passing yards early and late. That creates a larger deviation in the results - they don't tend to converge to the same degree - and greater year-to-year consistency.
So what are we to do with this information? That's the subject for next week, when I'll explain how to use strength of schedule and individual opponent quality both in your pre-draft rankings and in-season.
Jonathan Bales is the author of the Fantasy Football for Smart People book series. He also runs the "Running the Numbers" blog at DallasCowboys.com and writes for the New York Times.