
The goal is to identify some starting pitchers who might be undervalued on the basis of projected playing time, when otherwise their skills merit taking earlier than they are going, or how they are projected. This is especially helpful when hitting the middle to later rounds and you're looking to fill out your pitching staff.
First, here's a list of the current top 130 starting pitchers in a sortable chart:
| RANK | PLAYER | GS | WSGP | KSGP | ERASGP | WHIPSGP | TOTAL | MRG | $$VAL | VALUE |
|---|---|---|---|---|---|---|---|---|---|---|
| 1 | Max Scherzer | 33 | 4.737 | 6.575 | 2.821 | 2.162 | 16.295 | 10.972 | 38.016 | 38 |
| 2 | Jacob deGrom | 33 | 3.947 | 5.977 | 3.154 | 1.470 | 14.548 | 9.225 | 32.122 | 32 |
| 3 | Chris Sale | 30 | 3.947 | 5.977 | 2.338 | 1.810 | 14.072 | 8.749 | 30.516 | 31 |
| 4 | Justin Verlander | 33 | 4.211 | 6.000 | 2.144 | 1.637 | 13.992 | 8.669 | 30.246 | 30 |
| 5 | Corey Kluber | 32 | 4.474 | 5.448 | 2.333 | 1.705 | 13.960 | 8.637 | 30.138 | 30 |
| 6 | Aaron Nola | 33 | 4.211 | 5.080 | 1.928 | 1.120 | 12.339 | 7.016 | 24.670 | 25 |
| 7 | Blake Snell | 32 | 3.947 | 4.598 | 2.617 | 1.048 | 12.210 | 6.887 | 24.234 | 24 |
| 8 | Carlos Carrasco | 32 | 4.211 | 5.310 | 1.142 | 0.873 | 11.536 |
The goal is to identify some starting pitchers who might be undervalued on the basis of projected playing time, when otherwise their skills merit taking earlier than they are going, or how they are projected. This is especially helpful when hitting the middle to later rounds and you're looking to fill out your pitching staff.
First, here's a list of the current top 130 starting pitchers in a sortable chart:
| RANK | PLAYER | GS | WSGP | KSGP | ERASGP | WHIPSGP | TOTAL | MRG | $$VAL | VALUE |
|---|---|---|---|---|---|---|---|---|---|---|
| 1 | Max Scherzer | 33 | 4.737 | 6.575 | 2.821 | 2.162 | 16.295 | 10.972 | 38.016 | 38 |
| 2 | Jacob deGrom | 33 | 3.947 | 5.977 | 3.154 | 1.470 | 14.548 | 9.225 | 32.122 | 32 |
| 3 | Chris Sale | 30 | 3.947 | 5.977 | 2.338 | 1.810 | 14.072 | 8.749 | 30.516 | 31 |
| 4 | Justin Verlander | 33 | 4.211 | 6.000 | 2.144 | 1.637 | 13.992 | 8.669 | 30.246 | 30 |
| 5 | Corey Kluber | 32 | 4.474 | 5.448 | 2.333 | 1.705 | 13.960 | 8.637 | 30.138 | 30 |
| 6 | Aaron Nola | 33 | 4.211 | 5.080 | 1.928 | 1.120 | 12.339 | 7.016 | 24.670 | 25 |
| 7 | Blake Snell | 32 | 3.947 | 4.598 | 2.617 | 1.048 | 12.210 | 6.887 | 24.234 | 24 |
| 8 | Carlos Carrasco | 32 | 4.211 | 5.310 | 1.142 | 0.873 | 11.536 | 6.213 | 21.961 | 22 |
| 9 | Luis Severino | 31 | 3.947 | 4.966 | 0.905 | 1.158 | 10.976 | 5.653 | 20.071 | 20 |
| 10 | Jameson Taillon | 33 | 4.211 | 3.655 | 1.656 | 1.099 | 10.621 | 5.298 | 18.874 | 19 |
| 11 | Trevor Bauer | 31 | 3.947 | 5.103 | 1.275 | 0.275 | 10.600 | 5.277 | 18.803 | 19 |
| 12 | Mike Foltynewicz | 31 | 3.947 | 4.414 | 1.491 | 0.659 | 10.511 | 5.188 | 18.503 | 19 |
| 13 | Mike Clevinger | 30 | 3.684 | 4.253 | 1.756 | 0.733 | 10.426 | 5.103 | 18.216 | 18 |
| 14 | Noah Syndergaard | 29 | 3.684 | 4.345 | 1.736 | 0.569 | 10.334 | 5.011 | 17.905 | 18 |
| 15 | Gerrit Cole | 31 | 3.684 | 5.080 | 0.852 | 0.697 | 10.313 | 4.990 | 17.835 | 18 |
| 16 | Zack Greinke | 32 | 3.684 | 4.460 | 1.155 | 0.946 | 10.245 | 4.922 | 17.605 | 18 |
| 17 | Stephen Strasburg | 29 | 3.684 | 4.851 | 0.879 | 0.791 | 10.205 | 4.882 | 17.470 | 17 |
| 18 | Walker Buehler | 31 | 2.632 | 4.322 | 1.765 | 1.220 | 9.939 | 4.616 | 16.573 | 17 |
| 19 | Kyle Hendricks | 32 | 3.421 | 3.747 | 1.553 | 0.858 | 9.579 | 4.256 | 15.358 | 15 |
| 20 | Patrick Corbin | 32 | 3.421 | 4.736 | 0.653 | 0.215 | 9.025 | 3.702 | 13.489 | 13 |
| 21 | Clayton Kershaw | 25 | 3.421 | 3.471 | 1.257 | 0.745 | 8.894 | 3.571 | 13.047 | 13 |
| 22 | J.A. Happ | 29 | 3.947 | 3.931 | 0.597 | 0.413 | 8.888 | 3.565 | 13.027 | 13 |
| 23 | Luis Castillo | 32 | 3.421 | 4.483 | 0.348 | 0.572 | 8.824 | 3.501 | 12.811 | 13 |
| 24 | Jose Berrios | 32 | 3.684 | 4.299 | 0.267 | 0.557 | 8.807 | 3.484 | 12.754 | 13 |
| 25 | James Paxton | 27 | 3.421 | 4.391 | 0.339 | 0.595 | 8.746 | 3.423 | 12.548 | 13 |
| 26 | German Marquez | 31 | 3.421 | 4.690 | 0.453 | 0.146 | 8.710 | 3.387 | 12.427 | 12 |
| 27 | David Price | 31 | 3.947 | 4.184 | 0.426 | -0.024 | 8.533 | 3.210 | 11.829 | 12 |
| 28 | Charlie Morton | 27 | 3.684 | 3.931 | 0.608 | 0.287 | 8.510 | 3.187 | 11.752 | 12 |
| 29 | Jack Flaherty | 30 | 2.368 | 4.138 | 1.028 | 0.618 | 8.152 | 2.829 | 10.544 | 11 |
| 30 | Madison Bumgarner | 33 | 2.632 | 3.931 | 1.195 | 0.372 | 8.130 | 2.807 | 10.470 | 10 |
| 31 | Rich Hill | 23 | 3.158 | 3.494 | 0.770 | 0.702 | 8.124 | 2.801 | 10.450 | 10 |
| 32 | Rick Porcello | 33 | 3.947 | 4.299 | -0.569 | 0.329 | 8.006 | 2.683 | 10.052 | 10 |
| 33 | Zack Wheeler | 31 | 3.421 | 4.069 | 0.292 | 0.115 | 7.897 | 2.574 | 9.684 | 10 |
| 34 | Masahiro Tanaka | 29 | 3.421 | 3.954 | -0.114 | 0.598 | 7.859 | 2.536 | 9.556 | 10 |
| 35 | Miles Mikolas | 32 | 3.158 | 3.379 | 0.693 | 0.456 | 7.686 | 2.363 | 8.972 | 9 |
| 36 | Carlos Martinez | 27 | 2.895 | 3.839 | 0.947 | 0.003 | 7.684 | 2.361 | 8.965 | 9 |
| 37 | Kevin Gausman | 32 | 3.158 | 3.747 | 0.413 | 0.315 | 7.633 | 2.310 | 8.793 | 9 |
| 38 | Yusei Kikuchi | 29 | 2.368 | 4.046 | 0.746 | 0.454 | 7.614 | 2.291 | 8.729 | 9 |
| 39 | Cole Hamels | 29 | 3.421 | 3.747 | 0.171 | 0.091 | 7.430 | 2.107 | 8.108 | 8 |
| 40 | Andrew Heaney | 29 | 2.895 | 4.046 | 0.115 | 0.339 | 7.395 | 2.072 | 7.990 | 8 |
| 41 | Jose Quintana | 32 | 3.158 | 4.092 | -0.012 | 0.058 | 7.296 | 1.973 | 7.656 | 8 |
| 42 | Kyle Freeland | 30 | 3.421 | 3.218 | 0.812 | -0.276 | 7.175 | 1.852 | 7.248 | 7 |
| 43 | Chris Archer | 30 | 3.158 | 4.667 | -0.513 | -0.169 | 7.143 | 1.820 | 7.140 | 7 |
| 44 | Jhoulys Chacin | 33 | 3.158 | 3.425 | 0.199 | 0.203 | 6.985 | 1.662 | 6.607 | 7 |
| 45 | Dallas Keuchel | 29 | 3.158 | 3.287 | 0.492 | 0.040 | 6.977 | 1.654 | 6.580 | 7 |
| 46 | Jon Lester | 32 | 3.158 | 3.609 | 0.187 | -0.193 | 6.761 | 1.438 | 5.851 | 6 |
| 47 | Kenta Maeda | 23 | 2.895 | 3.517 | 0.002 | 0.302 | 6.716 | 1.393 | 5.700 | 6 |
| 48 | Jake Arrieta | 30 | 3.158 | 3.563 | -0.179 | 0.148 | 6.690 | 1.367 | 5.612 | 6 |
| 49 | Trevor Williams | 27 | 2.895 | 2.621 | 0.893 | 0.197 | 6.606 | 1.283 | 5.328 | 5 |
| 50 | Marco Gonzales | 31 | 2.632 | 3.563 | -0.044 | 0.451 | 6.602 | 1.279 | 5.315 | 5 |
| 51 | Brad Keller | 30 | 3.158 | 3.149 | 0.397 | -0.105 | 6.599 | 1.276 | 5.305 | 5 |
| 52 | Mike Minor | 30 | 2.895 | 3.218 | -0.437 | 0.887 | 6.563 | 1.240 | 5.183 | 5 |
| 53 | Joey Lucchesi | 29 | 2.632 | 3.632 | -0.086 | 0.263 | 6.441 | 1.118 | 4.772 | 5 |
| 54 | Jakob Junis | 30 | 2.632 | 3.678 | -0.460 | 0.591 | 6.441 | 1.118 | 4.772 | 5 |
| 55 | Chase Anderson | 28 | 2.632 | 2.943 | 0.431 | 0.391 | 6.397 | 1.074 | 4.623 | 5 |
| 56 | Ryan Yarbrough | 14 | 2.632 | 2.943 | 0.499 | 0.307 | 6.381 | 1.058 | 4.569 | 5 |
| 57 | Eduardo Rodriguez | 27 | 2.895 | 3.862 | -0.342 | -0.042 | 6.373 | 1.050 | 4.542 | 5 |
| 58 | Robbie Ray | 27 | 1.842 | 4.391 | 0.238 | -0.116 | 6.355 | 1.032 | 4.482 | 4 |
| 59 | Tyler Glasnow | 30 | 1.842 | 4.161 | -0.205 | 0.534 | 6.332 | 1.009 | 4.404 | 4 |
| 60 | Dereck Rodriguez | 28 | 1.579 | 3.172 | 1.067 | 0.472 | 6.290 | 0.967 | 4.262 | 4 |
| 61 | Joe Musgrove | 26 | 2.632 | 3.333 | -0.028 | 0.311 | 6.248 | 0.925 | 4.121 | 4 |
| 62 | Sean Newcomb | 30 | 2.895 | 3.862 | -0.106 | -0.424 | 6.227 | 0.904 | 4.050 | 4 |
| 63 | Tanner Roark | 31 | 3.158 | 3.609 | -0.530 | -0.051 | 6.186 | 0.863 | 3.911 | 4 |
| 64 | CC Sabathia | 28 | 2.895 | 3.103 | 0.311 | -0.146 | 6.163 | 0.840 | 3.834 | 4 |
| 65 | Zach Eflin | 26 | 3.158 | 2.966 | -0.377 | 0.328 | 6.075 | 0.752 | 3.537 | 4 |
| 66 | Julio Teheran | 31 | 2.368 | 3.655 | -0.227 | 0.270 | 6.066 | 0.743 | 3.507 | 4 |
| 67 | Shane Bieber | 32 | 2.895 | 4.023 | -0.838 | -0.016 | 6.064 | 0.741 | 3.500 | 3 |
| 68 | Carlos Rodon | 28 | 2.632 | 3.379 | 0.005 | 0.033 | 6.049 | 0.726 | 3.449 | 3 |
| 69 | Zack Godley | 32 | 2.895 | 4.345 | -0.849 | -0.382 | 6.009 | 0.686 | 3.314 | 3 |
| 70 | Gio Gonzalez | 32 | 3.158 | 3.563 | -0.413 | -0.318 | 5.990 | 0.667 | 3.250 | 3 |
| 71 | Reynaldo Lopez | 32 | 2.368 | 3.724 | -0.117 | -0.014 | 5.961 | 0.638 | 3.152 | 3 |
| 72 | Hyun-Jin Ryu | 20 | 2.105 | 2.437 | 1.063 | 0.290 | 5.895 | 0.572 | 2.930 | 3 |
| 73 | Yu Darvish | 26 | 2.105 | 4.000 | -0.210 | -0.031 | 5.864 | 0.541 | 2.825 | 3 |
| 74 | Lance Lynn | 31 | 2.895 | 3.655 | -0.155 | -0.595 | 5.800 | 0.477 | 2.609 | 3 |
| 75 | Alex Wood | 28 | 2.368 | 3.195 | 0.200 | 0.023 | 5.786 | 0.463 | 2.562 | 3 |
| 76 | Matt Boyd | 32 | 2.632 | 3.586 | -0.565 | -0.013 | 5.640 | 0.317 | 2.069 | 2 |
| 77 | Tyler Skaggs | 29 | 2.632 | 3.402 | -0.168 | -0.264 | 5.602 | 0.279 | 1.941 | 2 |
| 78 | Yonny Chirinos | 16 | 1.579 | 2.529 | 0.990 | 0.422 | 5.520 | 0.197 | 1.665 | 2 |
| 79 | Jon Gray | 31 | 2.895 | 4.184 | -1.345 | -0.215 | 5.519 | 0.196 | 1.661 | 2 |
| 80 | Freddy Peralta | 19 | 2.368 | 3.126 | -0.129 | 0.125 | 5.490 | 0.167 | 1.563 | 2 |
| 81 | Nick Pivetta | 30 | 2.368 | 4.092 | -1.018 | 0.004 | 5.446 | 0.123 | 1.415 | 1 |
| 82 | Sonny Gray | 29 | 2.632 | 3.540 | -1.031 | 0.270 | 5.411 | 0.088 | 1.297 | 1 |
| 83 | Nathan Eovaldi | 26 | 2.632 | 2.851 | -0.347 | 0.261 | 5.397 | 0.074 | 1.250 | 1 |
| 84 | Trevor Richards | 30 | 1.842 | 3.839 | -0.336 | 0.044 | 5.389 | 0.066 | 1.223 | 1 |
| 85 | Dylan Bundy | 31 | 3.158 | 4.414 | -1.912 | -0.317 | 5.343 | 0.020 | 1.067 | 1 |
| 86 | Josh James | 20 | 2.105 | 3.103 | 0.091 | 0.036 | 5.335 | 0.012 | 1.040 | 1 |
| 87 | Collin McHugh | 10 | 1.842 | 2.230 | 0.711 | 0.281 | 5.064 | -0.259 | 0.126 | 0 |
| 88 | Jose Urena | 27 | 2.632 | 2.575 | -0.365 | 0.169 | 5.011 | -0.312 | -0.053 | 0 |
| 89 | Ryan Borucki | 29 | 2.368 | 2.874 | -0.295 | 0.022 | 4.969 | -0.354 | -0.194 | 0 |
| 90 | Kyle Gibson | 30 | 2.895 | 3.379 | -0.659 | -0.692 | 4.923 | -0.400 | -0.349 | 0 |
| 91 | Ivan Nova | 30 | 2.632 | 2.805 | -0.530 | -0.002 | 4.905 | -0.418 | -0.410 | 0 |
| 92 | Jake Odorizzi | 31 | 2.105 | 3.471 | -0.620 | -0.105 | 4.851 | -0.472 | -0.592 | -1 |
| 93 | Clay Buchholz | 18 | 1.842 | 2.069 | 0.630 | 0.308 | 4.849 | -0.474 | -0.599 | -1 |
| 94 | Corbin Burnes | 24 | 1.842 | 3.057 | 0.014 | -0.138 | 4.775 | -0.548 | -0.849 | -1 |
| 95 | Tyler Anderson | 29 | 2.368 | 3.471 | -1.009 | -0.059 | 4.771 | -0.552 | -0.862 | -1 |
| 96 | Jonathan Loaisiga | 19 | 1.842 | 2.805 | 0.063 | 0.004 | 4.714 | -0.609 | -1.055 | -1 |
| 97 | Danny Duffy | 27 | 2.368 | 3.333 | -0.638 | -0.385 | 4.678 | -0.645 | -1.176 | -1 |
| 98 | Sandy Alcantara | 27 | 1.842 | 3.333 | -0.110 | -0.393 | 4.672 | -0.651 | -1.196 | -1 |
| 99 | Mike Leake | 31 | 2.632 | 2.851 | -0.704 | -0.126 | 4.653 | -0.670 | -1.260 | -1 |
| 100 | Ervin Santana | 22 | 1.842 | 2.437 | 0.056 | 0.294 | 4.629 | -0.694 | -1.341 | -1 |
| 101 | Marcus Stroman | 31 | 2.368 | 3.333 | -0.600 | -0.495 | 4.606 | -0.717 | -1.419 | -1 |
| 102 | Mike Fiers | 30 | 2.632 | 3.241 | -0.976 | -0.407 | 4.490 | -0.833 | -1.810 | -2 |
| 103 | Fernando Romero | 21 | 1.842 | 2.391 | 0.269 | -0.036 | 4.466 | -0.857 | -1.891 | -2 |
| 104 | Michael Wacha | 22 | 2.368 | 2.460 | -0.133 | -0.234 | 4.461 | -0.862 | -1.908 | -2 |
| 105 | Anthony DeSclafani | 24 | 2.105 | 2.874 | -0.502 | -0.028 | 4.449 | -0.874 | -1.949 | -2 |
| 106 | Michael Fulmer | 25 | 1.842 | 2.644 | -0.305 | 0.239 | 4.420 | -0.903 | -2.046 | -2 |
| 107 | Alex Cobb | 28 | 2.105 | 2.736 | -0.401 | -0.110 | 4.330 | -0.993 | -2.350 | -2 |
| 108 | Steven Matz | 28 | 1.842 | 3.126 | -0.580 | -0.078 | 4.310 | -1.013 | -2.418 | -2 |
| 109 | Joe Ross | 24 | 1.842 | 2.782 | 0.014 | -0.351 | 4.287 | -1.036 | -2.495 | -2 |
| 110 | Brandon Woodruff | 14 | 1.842 | 2.138 | 0.033 | 0.104 | 4.117 | -1.206 | -3.069 | -3 |
| 111 | Alex Reyes | 14 | 1.579 | 2.253 | 0.319 | -0.131 | 4.020 | -1.303 | -3.396 | -3 |
| 112 | Caleb Smith | 21 | 1.579 | 2.667 | -0.253 | 0.004 | 3.997 | -1.326 | -3.473 | -3 |
| 113 | Wade LeBlanc | 15 | 1.579 | 2.115 | 0.003 | 0.300 | 3.997 | -1.326 | -3.473 | -3 |
| 114 | Mike Soroka | 17 | 1.579 | 1.793 | 0.474 | 0.139 | 3.985 | -1.338 | -3.514 | -4 |
| 115 | Touki Toussaint | 15 | 1.579 | 2.138 | 0.199 | -0.012 | 3.904 | -1.419 | -3.787 | -4 |
| 116 | Jesus Luzardo | 16 | 1.316 | 1.931 | 0.497 | 0.145 | 3.889 | -1.434 | -3.838 | -4 |
| 117 | Steven Wright | 11 | 1.579 | 1.655 | 0.598 | 0.016 | 3.848 | -1.475 | -3.976 | -4 |
| 118 | Tyson Ross | 20 | 1.842 | 2.483 | -0.642 | 0.106 | 3.789 | -1.534 | -4.175 | -4 |
| 119 | Forrest Whitley | 14 | 1.316 | 1.724 | 0.279 | 0.455 | 3.774 | -1.549 | -4.226 | -4 |
| 120 | Ross Stripling | 5 | 1.053 | 2.069 | 0.427 | 0.170 | 3.719 | -1.604 | -4.411 | -4 |
| 121 | Adalberto Mejia | 19 | 1.579 | 1.931 | 0.359 | -0.151 | 3.718 | -1.605 | -4.415 | -4 |
| 122 | John Gant | 17 | 1.579 | 2.115 | 0.250 | -0.230 | 3.714 | -1.609 | -4.428 | -4 |
| 123 | Andrew Suarez | 26 | 1.579 | 2.828 | -0.508 | -0.195 | 3.704 | -1.619 | -4.462 | -4 |
| 124 | Vince Velasquez | 26 | 2.105 | 3.218 | -1.257 | -0.424 | 3.642 | -1.681 | -4.671 | -5 |
| 125 | Jeremy Hellickson | 25 | 1.842 | 2.069 | -0.690 | 0.414 | 3.635 | -1.688 | -4.695 | -5 |
| 126 | Anibal Sanchez | 22 | 1.579 | 2.874 | -0.720 | -0.128 | 3.605 | -1.718 | -4.796 | -5 |
| 127 | Eric Lauer | 24 | 1.842 | 2.621 | -0.230 | -0.663 | 3.570 | -1.753 | -4.914 | -5 |
| 128 | Dan Straily | 31 | 2.105 | 3.195 | -1.088 | -0.706 | 3.506 | -1.817 | -5.130 | -5 |
| 129 | Jimmy Nelson | 23 | 2.105 | 2.667 | -0.647 | -0.641 | 3.484 | -1.839 | -5.204 | -5 |
| 130 | Julio Urias | 17 | 1.579 | 1.885 | 0.109 | -0.089 | 3.484 | -1.839 | -5.204 | -5 |
I went to 130 pitchers to incorporate a wide range of potential starters taken in our drafts, even though your standard 12-team mixed league will have only 108 active pitchers at any given time. That, and I wanted to make sure to include Julio Urias in the original set as he's a really interesting case.
Methodology
I use SGPs when computing the dollar values for the site and the magazine. There are other good methods to value players, but I've found this works best for me. Perhaps if had better programming/Excel skills, I'd be able to come up with something better. Anyhow, for this exercise, I calculated the SGPs earned per start for each pitcher, and then set each pitcher for 30 starts.
Why 30 starts, and not a full 33 starts? I wanted to make sure that *some* injury risk was accounted for, and address that pitchers as a class make fewer starts per year than they have in the past. But … I also want to see middle-and-lower tier starters who are nonetheless durable enough to get projected for 32-33 starts, like Mike Leake, get lowered a bit by this exercise. Closers were obviously excluded from this exercise - that's a tautology given that I'm using starts as my baseline, but even if I were using innings pitched instead I'd still exclude them, because their currency is almost entirely based on saves and not innings pitched. It's an opportunity stat, not a volume stat.
Results
It should come as no surprise that the pitchers who benefited the most from this exercise either had elite ratios (like Clayton Kershaw), or had significantly fewer starts than the 30-start baseline.
Here are the full numbers, also in a sortable chart:
| RANK | PREVIOUS | PLAYER | GS | WSGP | KSGP | ERASGP | WHIPSGP | TOTAL | TOTAL/GS | SGP30 |
|---|---|---|---|---|---|---|---|---|---|---|
| 1 | 1 | Max Scherzer | 33 | 4.737 | 6.575 | 2.821 | 2.162 | 16.295 | 0.49 | 14.81 |
| 2 | 3 | Chris Sale | 30 | 3.947 | 5.977 | 2.338 | 1.810 | 14.073 | 0.47 | 14.07 |
| 3 | 2 | Jacob deGrom | 33 | 3.947 | 5.977 | 3.154 | 1.470 | 14.549 | 0.44 | 13.23 |
| 4 | 5 | Corey Kluber | 32 | 4.474 | 5.448 | 2.333 | 1.705 | 13.961 | 0.44 | 13.09 |
| 5 | 4 | Justin Verlander | 33 | 4.211 | 6.000 | 2.144 | 1.637 | 13.992 | 0.42 | 12.72 |
| 6 | 7 | Blake Snell | 32 | 3.947 | 4.598 | 2.617 | 1.048 | 12.211 | 0.38 | 11.45 |
| 7 | 6 | Aaron Nola | 33 | 4.211 | 5.080 | 1.928 | 1.120 | 12.338 | 0.37 | 11.22 |
| 8 | 8 | Carlos Carrasco | 32 | 4.211 | 5.310 | 1.142 | 0.873 | 11.536 | 0.36 | 10.81 |
| 9 | 14 | Noah Syndergaard | 29 | 3.684 | 4.345 | 1.736 | 0.569 | 10.334 | 0.36 | 10.69 |
| 10 | 21 | Clayton Kershaw | 25 | 3.421 | 3.471 | 1.257 | 0.745 | 8.894 | 0.36 | 10.67 |
| 11 | 9 | Luis Severino | 31 | 3.947 | 4.966 | 0.905 | 1.158 | 10.977 | 0.35 | 10.62 |
| 12 | 31 | Rich Hill | 23 | 3.158 | 3.494 | 0.770 | 0.702 | 8.125 | 0.35 | 10.60 |
| 13 | 17 | Stephen Strasburg | 29 | 3.684 | 4.851 | 0.879 | 0.791 | 10.205 | 0.35 | 10.56 |
| 14 | 13 | Mike Clevinger | 30 | 3.684 | 4.253 | 1.756 | 0.733 | 10.427 | 0.35 | 10.43 |
| 15 | 11 | Trevor Bauer | 31 | 3.947 | 5.103 | 1.275 | 0.275 | 10.601 | 0.34 | 10.26 |
| 16 | 12 | Mike Foltynewicz | 31 | 3.947 | 4.414 | 1.491 | 0.659 | 10.512 | 0.34 | 10.17 |
| 17 | 15 | Gerrit Cole | 31 | 3.684 | 5.080 | 0.852 | 0.697 | 10.314 | 0.33 | 9.98 |
| 18 | 25 | James Paxton | 27 | 3.421 | 4.391 | 0.339 | 0.595 | 8.746 | 0.32 | 9.72 |
| 19 | 10 | Jameson Taillon | 33 | 4.211 | 3.655 | 1.656 | 1.099 | 10.620 | 0.32 | 9.65 |
| 20 | 18 | Walker Buehler | 31 | 2.632 | 4.322 | 1.765 | 1.220 | 9.938 | 0.32 | 9.62 |
| 21 | 16 | Zack Greinke | 32 | 3.684 | 4.460 | 1.155 | 0.946 | 10.245 | 0.32 | 9.61 |
| 22 | 28 | Charlie Morton | 27 | 3.684 | 3.931 | 0.608 | 0.287 | 8.511 | 0.32 | 9.46 |
| 23 | 22 | J.A. Happ | 29 | 3.947 | 3.931 | 0.597 | 0.413 | 8.888 | 0.31 | 9.19 |
| 24 | 19 | Kyle Hendricks | 32 | 3.421 | 3.747 | 1.553 | 0.858 | 9.579 | 0.3 | 8.98 |
| 25 | 72 | Hyun-Jin Ryu | 20 | 2.105 | 2.437 | 1.063 | 0.290 | 5.895 | 0.29 | 8.84 |
| 26 | 110 | Brandon Woodruff | 14 | 1.842 | 2.138 | 0.033 | 0.104 | 4.117 | 0.29 | 8.82 |
| 27 | 47 | Kenta Maeda | 23 | 2.895 | 3.517 | 0.002 | 0.302 | 6.716 | 0.29 | 8.76 |
| 28 | 80 | Freddy Peralta | 19 | 2.368 | 3.126 | -0.129 | 0.125 | 5.490 | 0.29 | 8.67 |
| 29 | 111 | Alex Reyes | 14 | 1.579 | 2.253 | 0.319 | -0.131 | 4.020 | 0.29 | 8.61 |
| 30 | 36 | Carlos Martinez | 27 | 2.895 | 3.839 | 0.947 | 0.003 | 7.684 | 0.28 | 8.54 |
| 31 | 20 | Patrick Corbin | 32 | 3.421 | 4.736 | 0.653 | 0.215 | 9.025 | 0.28 | 8.46 |
| 32 | 26 | German Marquez | 31 | 3.421 | 4.690 | 0.453 | 0.146 | 8.710 | 0.28 | 8.43 |
| 33 | 23 | Luis Castillo | 32 | 3.421 | 4.483 | 0.348 | 0.572 | 8.824 | 0.28 | 8.27 |
| 34 | 27 | David Price | 31 | 3.947 | 4.184 | 0.426 | -0.024 | 8.533 | 0.28 | 8.26 |
| 35 | 24 | Jose Berrios | 32 | 3.684 | 4.299 | 0.267 | 0.557 | 8.807 | 0.28 | 8.26 |
| 36 | 29 | Jack Flaherty | 30 | 2.368 | 4.138 | 1.028 | 0.618 | 8.153 | 0.27 | 8.15 |
| 37 | 34 | Masahiro Tanaka | 29 | 3.421 | 3.954 | -0.114 | 0.598 | 7.859 | 0.27 | 8.13 |
| 38 | 119 | Forrest Whitley | 14 | 1.316 | 1.724 | 0.279 | 0.455 | 3.774 | 0.27 | 8.09 |
| 39 | 93 | Clay Buchholz | 18 | 1.842 | 2.069 | 0.630 | 0.308 | 4.849 | 0.27 | 8.08 |
| 40 | 86 | Josh James | 20 | 2.105 | 3.103 | 0.091 | 0.036 | 5.336 | 0.27 | 8.00 |
| 41 | 113 | Wade LeBlanc | 15 | 1.579 | 2.115 | 0.003 | 0.300 | 3.996 | 0.27 | 7.99 |
| 42 | 38 | Yusei Kikuchi | 29 | 2.368 | 4.046 | 0.746 | 0.454 | 7.614 | 0.26 | 7.88 |
| 43 | 115 | Touki Toussaint | 15 | 1.579 | 2.138 | 0.199 | -0.012 | 3.903 | 0.26 | 7.81 |
| 44 | 39 | Cole Hamels | 29 | 3.421 | 3.747 | 0.171 | 0.091 | 7.430 | 0.26 | 7.69 |
| 45 | 40 | Andrew Heaney | 29 | 2.895 | 4.046 | 0.115 | 0.339 | 7.395 | 0.25 | 7.65 |
| 46 | 33 | Zack Wheeler | 31 | 3.421 | 4.069 | 0.292 | 0.115 | 7.897 | 0.25 | 7.64 |
| 47 | 96 | Jonathan Loaisiga | 19 | 1.842 | 2.805 | 0.063 | 0.004 | 4.714 | 0.25 | 7.44 |
| 48 | 30 | Madison Bumgarner | 33 | 2.632 | 3.931 | 1.195 | 0.372 | 8.129 | 0.25 | 7.39 |
| 49 | 49 | Trevor Williams | 27 | 2.895 | 2.621 | 0.893 | 0.197 | 6.606 | 0.24 | 7.34 |
| 50 | 116 | Jesus Luzardo | 16 | 1.316 | 1.931 | 0.497 | 0.145 | 3.889 | 0.24 | 7.29 |
| 51 | 32 | Rick Porcello | 33 | 3.947 | 4.299 | -0.569 | 0.329 | 8.006 | 0.24 | 7.28 |
| 52 | 45 | Dallas Keuchel | 29 | 3.158 | 3.287 | 0.492 | 0.040 | 6.977 | 0.24 | 7.22 |
| 53 | 61 | Joe Musgrove | 26 | 2.632 | 3.333 | -0.028 | 0.311 | 6.248 | 0.24 | 7.21 |
| 54 | 35 | Miles Mikolas | 32 | 3.158 | 3.379 | 0.693 | 0.456 | 7.687 | 0.24 | 7.21 |
| 55 | 42 | Kyle Freeland | 30 | 3.421 | 3.218 | 0.812 | -0.276 | 7.176 | 0.24 | 7.18 |
| 56 | 37 | Kevin Gausman | 32 | 3.158 | 3.747 | 0.413 | 0.315 | 7.633 | 0.24 | 7.16 |
| 57 | 43 | Chris Archer | 30 | 3.158 | 4.667 | -0.513 | -0.169 | 7.143 | 0.24 | 7.14 |
| 58 | 57 | Eduardo Rodriguez | 27 | 2.895 | 3.862 | -0.342 | -0.042 | 6.373 | 0.24 | 7.08 |
| 59 | 58 | Robbie Ray | 27 | 1.842 | 4.391 | 0.238 | -0.116 | 6.355 | 0.24 | 7.06 |
| 60 | 114 | Mike Soroka | 17 | 1.579 | 1.793 | 0.474 | 0.139 | 3.985 | 0.23 | 7.03 |
| 61 | 65 | Zach Eflin | 26 | 3.158 | 2.966 | -0.377 | 0.328 | 6.075 | 0.23 | 7.01 |
| 62 | -- | Daniel Poncedeleon | 10 | 0.789 | 1.287 | 0.290 | -0.034 | 2.333 | 0.23 | 7.00 |
| 63 | 55 | Chase Anderson | 28 | 2.632 | 2.943 | 0.431 | 0.391 | 6.397 | 0.23 | 6.85 |
| 64 | 41 | Jose Quintana | 32 | 3.158 | 4.092 | -0.012 | 0.058 | 7.296 | 0.23 | 6.84 |
| 65 | 73 | Yu Darvish | 26 | 2.105 | 4.000 | -0.210 | -0.031 | 5.864 | 0.23 | 6.77 |
| 66 | 60 | Dereck Rodriguez | 28 | 1.579 | 3.172 | 1.067 | 0.472 | 6.290 | 0.22 | 6.74 |
| 67 | 48 | Jake Arrieta | 30 | 3.158 | 3.563 | -0.179 | 0.148 | 6.690 | 0.22 | 6.69 |
| 68 | 53 | Joey Lucchesi | 29 | 2.632 | 3.632 | -0.086 | 0.263 | 6.441 | 0.22 | 6.66 |
| 69 | -- | Roenis Elias | 13 | 1.053 | 1.678 | 0.202 | -0.047 | 2.886 | 0.22 | 6.66 |
| 70 | 64 | CC Sabathia | 28 | 2.895 | 3.103 | 0.311 | -0.146 | 6.163 | 0.22 | 6.60 |
| 71 | 51 | Brad Keller | 30 | 3.158 | 3.149 | 0.397 | -0.105 | 6.599 | 0.22 | 6.60 |
| 72 | 52 | Mike Minor | 30 | 2.895 | 3.218 | -0.437 | 0.887 | 6.563 | 0.22 | 6.56 |
| 73 | 122 | John Gant | 17 | 1.579 | 2.115 | 0.250 | -0.230 | 3.715 | 0.22 | 6.56 |
| 74 | 68 | Carlos Rodon | 28 | 2.632 | 3.379 | 0.005 | 0.033 | 6.049 | 0.22 | 6.48 |
| 75 | 54 | Jakob Junis | 30 | 2.632 | 3.678 | -0.460 | 0.591 | 6.441 | 0.21 | 6.44 |
| 76 | 50 | Marco Gonzales | 31 | 2.632 | 3.563 | -0.044 | 0.451 | 6.602 | 0.21 | 6.39 |
| 77 | 103 | Fernando Romero | 21 | 1.842 | 2.391 | 0.269 | -0.036 | 4.466 | 0.21 | 6.38 |
| 78 | 44 | Jhoulys Chacin | 33 | 3.158 | 3.425 | 0.199 | 0.203 | 6.985 | 0.21 | 6.35 |
| 79 | 46 | Jon Lester | 32 | 3.158 | 3.609 | 0.187 | -0.193 | 6.761 | 0.21 | 6.34 |
| 80 | 59 | Tyler Glasnow | 30 | 1.842 | 4.161 | -0.205 | 0.534 | 6.332 | 0.21 | 6.33 |
| 81 | 100 | Ervin Santana | 22 | 1.842 | 2.437 | 0.056 | 0.294 | 4.629 | 0.21 | 6.31 |
| 82 | 83 | Nathan Eovaldi | 26 | 2.632 | 2.851 | -0.347 | 0.261 | 5.397 | 0.21 | 6.23 |
| 83 | 62 | Sean Newcomb | 30 | 2.895 | 3.862 | -0.106 | -0.424 | 6.227 | 0.21 | 6.23 |
| 84 | 75 | Alex Wood | 28 | 2.368 | 3.195 | 0.200 | 0.023 | 5.787 | 0.21 | 6.20 |
| 85 | 130 | Julio Urias | 17 | 1.579 | 1.885 | 0.109 | -0.089 | 3.483 | 0.2 | 6.15 |
| 86 | 104 | Michael Wacha | 22 | 2.368 | 2.460 | -0.133 | -0.234 | 4.462 | 0.2 | 6.08 |
| 87 | 63 | Tanner Roark | 31 | 3.158 | 3.609 | -0.530 | -0.051 | 6.186 | 0.2 | 5.99 |
| 88 | 94 | Corbin Burnes | 24 | 1.842 | 3.057 | 0.014 | -0.138 | 4.776 | 0.2 | 5.97 |
| 89 | -- | Mitch Keller | 11 | 0.789 | 1.264 | 0.044 | 0.085 | 2.183 | 0.2 | 5.95 |
| 90 | 66 | Julio Teheran | 31 | 2.368 | 3.655 | -0.227 | 0.270 | 6.067 | 0.2 | 5.87 |
| 91 | 121 | Adalberto Mejia | 19 | 1.579 | 1.931 | 0.359 | -0.151 | 3.718 | 0.2 | 5.87 |
| 92 | 77 | Tyler Skaggs | 29 | 2.632 | 3.402 | -0.168 | -0.264 | 5.602 | 0.19 | 5.80 |
| 93 | -- | Trevor Cahill | 18 | 1.316 | 2.483 | -0.137 | -0.201 | 3.460 | 0.19 | 5.77 |
| 94 | -- | Matt Shoemaker | 15 | 1.579 | 1.747 | -0.486 | 0.034 | 2.873 | 0.19 | 5.75 |
| 95 | 112 | Caleb Smith | 21 | 1.579 | 2.667 | -0.253 | 0.004 | 3.996 | 0.19 | 5.71 |
| 96 | 67 | Shane Bieber | 32 | 2.895 | 4.023 | -0.838 | -0.016 | 6.063 | 0.19 | 5.68 |
| 97 | 118 | Tyson Ross | 20 | 1.842 | 2.483 | -0.642 | 0.106 | 3.788 | 0.19 | 5.68 |
| 98 | 69 | Zack Godley | 32 | 2.895 | 4.345 | -0.849 | -0.382 | 6.008 | 0.19 | 5.63 |
| 99 | 70 | Gio Gonzalez | 32 | 3.158 | 3.563 | -0.413 | -0.318 | 5.990 | 0.19 | 5.62 |
| 100 | 74 | Lance Lynn | 31 | 2.895 | 3.655 | -0.155 | -0.595 | 5.800 | 0.19 | 5.61 |
| 101 | 82 | Sonny Gray | 29 | 2.632 | 3.540 | -1.031 | 0.270 | 5.411 | 0.19 | 5.60 |
| 102 | 71 | Reynaldo Lopez | 32 | 2.368 | 3.724 | -0.117 | -0.014 | 5.962 | 0.19 | 5.59 |
| 103 | 88 | Jose Urena | 27 | 2.632 | 2.575 | -0.365 | 0.169 | 5.010 | 0.19 | 5.57 |
| 104 | 105 | Anthony DeSclafani | 24 | 2.105 | 2.874 | -0.502 | -0.028 | 4.448 | 0.19 | 5.56 |
| 105 | 81 | Nick Pivetta | 30 | 2.368 | 4.092 | -1.018 | 0.004 | 5.447 | 0.18 | 5.45 |
| 106 | 84 | Trevor Richards | 30 | 1.842 | 3.839 | -0.336 | 0.044 | 5.389 | 0.18 | 5.39 |
| 107 | 109 | Joe Ross | 24 | 1.842 | 2.782 | 0.014 | -0.351 | 4.287 | 0.18 | 5.36 |
| 108 | 79 | Jon Gray | 31 | 2.895 | 4.184 | -1.345 | -0.215 | 5.519 | 0.18 | 5.34 |
| 109 | -- | Antonio Senzatela | 19 | 1.842 | 2.207 | -0.534 | -0.156 | 3.360 | 0.18 | 5.30 |
| 110 | 106 | Michael Fulmer | 25 | 1.842 | 2.644 | -0.305 | 0.239 | 4.420 | 0.18 | 5.30 |
| 111 | 76 | Matt Boyd | 32 | 2.632 | 3.586 | -0.565 | -0.013 | 5.639 | 0.18 | 5.29 |
| 112 | 97 | Danny Duffy | 27 | 2.368 | 3.333 | -0.638 | -0.385 | 4.679 | 0.17 | 5.20 |
| 113 | 98 | Sandy Alcantara | 27 | 1.842 | 3.333 | -0.110 | -0.393 | 4.672 | 0.17 | 5.19 |
| 114 | 85 | Dylan Bundy | 31 | 3.158 | 4.414 | -1.912 | -0.317 | 5.343 | 0.17 | 5.17 |
| 115 | 89 | Ryan Borucki | 29 | 2.368 | 2.874 | -0.295 | 0.022 | 4.970 | 0.17 | 5.14 |
| 116 | -- | Dylan Cease | 9 | 0.526 | 1.103 | 0.019 | -0.113 | 1.535 | 0.17 | 5.12 |
| 117 | 95 | Tyler Anderson | 29 | 2.368 | 3.471 | -1.009 | -0.059 | 4.772 | 0.16 | 4.94 |
| 118 | 90 | Kyle Gibson | 30 | 2.895 | 3.379 | -0.659 | -0.692 | 4.923 | 0.16 | 4.92 |
| 119 | 126 | Anibal Sanchez | 22 | 1.579 | 2.874 | -0.720 | -0.128 | 3.605 | 0.16 | 4.92 |
| 120 | 91 | Ivan Nova | 30 | 2.632 | 2.805 | -0.530 | -0.002 | 4.903 | 0.16 | 4.90 |
| 121 | -- | Jake Faria | 21 | 1.579 | 2.575 | -0.571 | -0.240 | 3.343 | 0.16 | 4.78 |
| 122 | 92 | Jake Odorizzi | 31 | 2.105 | 3.471 | -0.620 | -0.105 | 4.852 | 0.16 | 4.70 |
| 123 | 107 | Alex Cobb | 28 | 2.105 | 2.736 | -0.401 | -0.110 | 4.330 | 0.15 | 4.64 |
| 124 | -- | Max Fried | 12 | 0.789 | 1.701 | -0.298 | -0.341 | 1.852 | 0.15 | 4.63 |
| 125 | 108 | Steven Matz | 28 | 1.842 | 3.126 | -0.580 | -0.078 | 4.311 | 0.15 | 4.62 |
| 126 | -- | Michael Pineda | 20 | 1.579 | 2.506 | -0.876 | -0.131 | 3.078 | 0.15 | 4.62 |
| 127 | -- | Jeff Samardzija | 21 | 1.579 | 2.552 | -0.987 | 0.083 | 3.227 | 0.15 | 4.61 |
| 128 | 129 | Jimmy Nelson | 23 | 2.105 | 2.667 | -0.647 | -0.641 | 3.484 | 0.15 | 4.54 |
| 129 | -- | Zach Davies | 22 | 1.842 | 2.023 | -0.352 | -0.200 | 3.313 | 0.15 | 4.52 |
| 130 | 99 | Mike Leake | 31 | 2.632 | 2.851 | -0.704 | -0.126 | 4.652 | 0.15 | 4.50 |
| 131 | 102 | Mike Fiers | 30 | 2.632 | 3.241 | -0.976 | -0.407 | 4.491 | 0.15 | 4.49 |
| 132 | -- | Chris Bassitt | 15 | 1.053 | 1.333 | 0.035 | -0.187 | 2.233 | 0.15 | 4.47 |
| 133 | 127 | Eric Lauer | 24 | 1.842 | 2.621 | -0.230 | -0.663 | 3.570 | 0.15 | 4.46 |
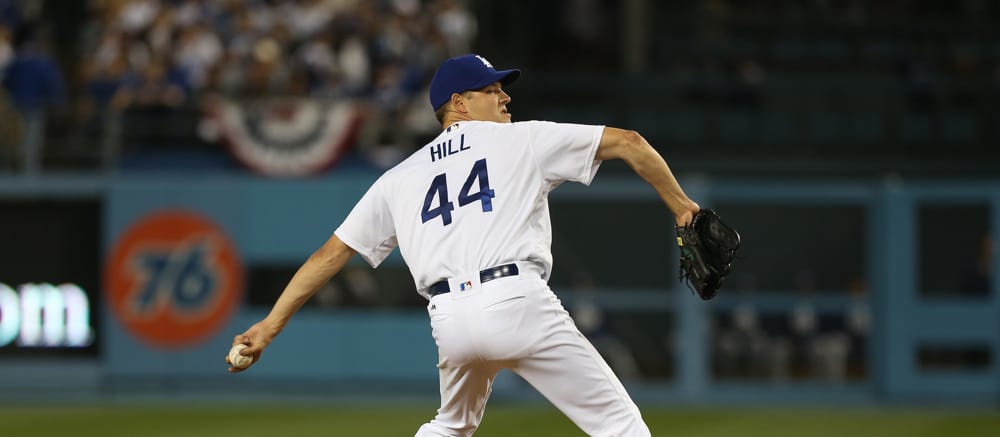
It should come as no surprise that Dodgers benefit from this exercise. Clayton Kershaw went from 21 to 10, Rich Hill went all the way from 31 to 12 (as he went from 23 projected starts to 30), Kenta Maeda improved from 47 to 27, Hyun-Jin Ryu leaped from 72 to 25 and Julio Urias jumped from 130 to 85. Only Walker Buehler among the Dodgers starters didn't benefit, as he's the only one projected with a full compliment of starts. In fact, I had to exclude a seventh starter, Ross Stripling, because his improvement made him such an outlier that it would have thrown off the entire scale. That's probably an indictment of my methodology, or my projection for Stripling, which gives him only five starts for now, but I digress. In fact, I'm going to bump that up after this article – probably somewhere closer to 15 starts. But I view him as their seventh option, though one could debate that between him and Urias.
The Dodgers do present an issue to us, in that they plan on their pitchers skipping some starts here-and-there, and they also pitch shorter outings. Alex Wood led the team in starts with 27, and Clayton Kershaw led them in innings pitched at 161.1 last season. Seven starters made 15 or more starts, with Ryu coming in at 15 starts. Some of this is because of injury (Hill, Ryu), and some of this is to shifting roles, like Maeda and Stripling. But make no mistake, this is the residue of design, not happenstance. The Dodgers built up their depth in starters precisely to account for fragility and to prevent catastrophic loss. In 2017, Kershaw led them with 27 starts and 175 innings, and six starters had 16-plus starts. In 2016, Maeda was a bit of an outlier with 32 starts, but even then he only pitched 175.2 innings. Nobody else reached 150 innings. Under the Andrew Friedman/Farhan Zaidi/Dave Roberts regime, this is a feature, not a bug.
Consequently, these pitchers necessarily have fewer projected starts. It would be irresponsible to bump them all up. In fact, now I'm a little worried about Walker Buehler's projection in that it might be too optimistic. This point holds altogether – we're trying to find upside among pitchers that for whatever reason have fewer starts – in part because they are going to be more optimally used than a Mike Leake type of pitcher. But the fact is they are projected for fewer starts for good reason, and thus need a little discount at the draft table.
The Dodgers are not the only problematic team. The Astros have similar starting pitching depth, and that just got better with the addition of Wade Miley. I had to exclude Collin McHugh's results because I still have a projection where he's working the bullpen for the majority of the season, and his ratios in relief have been through the roof. Obviously there's going to be some degradation in quality when he's stretched out as a starter. The Rays have pioneered the use of an opener, which makes "starts" a laughable concept for those of us doing projections. Still, to try to preserve the value of the pitchers that come in the game in the second inning and have some length, like Yonny Chirinos and Ryan Yarbrough, I have projected a modicum of starts for them. But pushing them up to 30 starts really skews their values as well, so they've been excluded.
Who else benefits from neutralizing the playing time?
• Injury Prone Starters - James Paxton hasn't topped 28 starts or 160 innings in a big league season, but if he ever were to get a full set of starts, his value would obviously spike.
• Prospects - Jesus Luzardo and especially Forrest Whitley are projected to begin the season in the minors and thus have fewer projected starts, but what if injuries strike or each pitcher dominates so much as to get an April callup?
• Job Battles - This is loosely tied with prospects, as typically the pitchers that are projected with hybrid relief/starter roles are young pitchers that aren't fully established yet, though the difference is that their team is willing to use them in relief to keep them at the big league level. Ross Stripling fits this category, as does Daniel Poncedeleon on the Cardinals. The Cardinals have remarkable starting pitching depth this year and are particularly difficult to project after the top two starters.
I mentioned the possibility of running the numbers using a different methodology – you could make the case that innings rather than starts should be my denominator. In fact, FanGraphs does that, with its Steamer 600 projections, which are set to 200 innings as their baseline. But they also don't filter out relievers in the process, which makes the results difficult to review for fantasy purposes. I also think I'd set the baseline closer to 185 innings, for the same reason that I set the starts to 30 rather than 32 or 33.
But even if I did that, some of the problems that existed with my methodology would remain. Relief pitchers produce better ratios than starters because they can go max-effort, don't have to go through an order twice in an outing, and in many cases get to face optimal matchups – either batters with the same handedness, or pinch-hitters who aren't good enough to start. And you can see that with the Steamer 600 results – pitchers like Ray Black and Diego Castillo rank high, despite not having a fantasy friendly role. If you have enough of a dataset to strip out his ratios as a starter vs. his ratios as a reliever, then you might find an innings-based approach to be more helpful.
This is just one way to spot a few outliers, but it's a good reminder how much of a role projected opportunity plays in our rankings, whether you use RotoWire, Steamer or any other source. Hopefully this helps you spot potential upside in a few starters who can give you an advantage in the endgame, or illustrates a pitcher that could be undervalued. We'll do a similar exercise with batters in this space in the next installment.