
Before delving into the topic at hand, let's put a bow on tracking the home run data. My research shows the home run rate (HR/PA) is predictive after 450 games. MLB reached the milestone earlier this week. As has been the lean, 2021 just a tick ahead of 2017. If the trend holds true, the final HR% should be close to 3.44%. In 2019, it was 3.82% while 2017 finished at 3.29%.
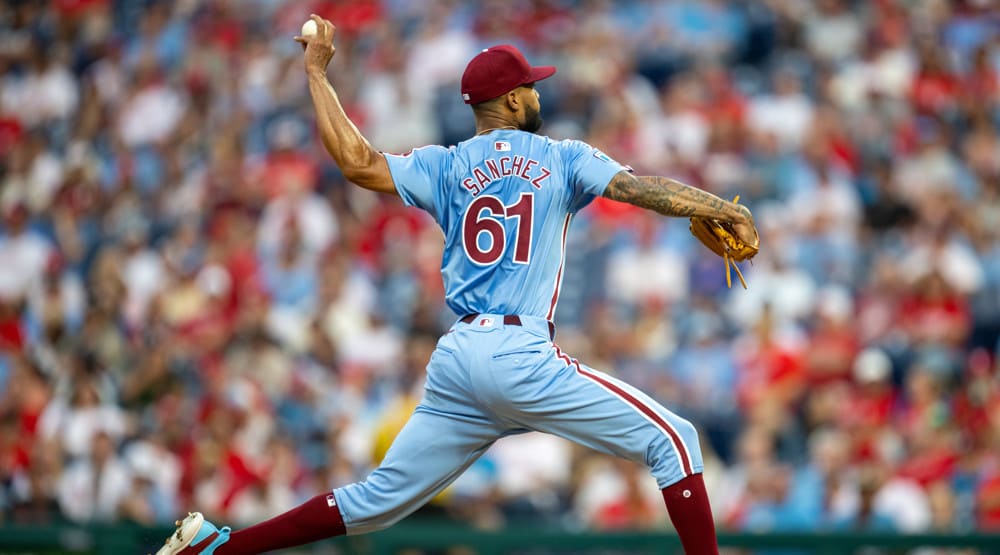
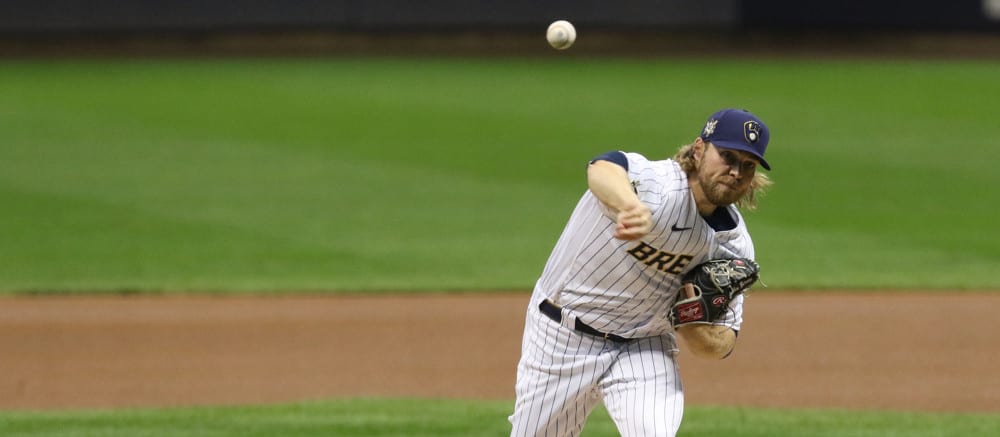
With homers wrapped up, let's turn our attention to strikeouts. One of the early storylines is the spike in punchouts throughout MLB. My hypothesis is if there is a specific subset of pitchers responsible for the increase, we can leverage that information when making moves. This is applicable in season-long formats with respect to trades and acquisitions, as well as aiding when streaming pitchers. It's also apropos to DFS since strikeouts are such a key component of scoring.
To begin, here is a lay of the land, looking at the season through Thursday's games compared to a similar number of games in 2019 and 2018. I'm not including 2020 since there were so many nuances disqualifying the data.
| K% | 2021 | 2019 | 2018 |
|---|---|---|---|
| Overall | 24.5 | 23.0 | 22.3 |
| Starter | 24.1 | 22.3 | 21.6 |
| Reliever | 25 | 23.9 | 23.2 |
| Home | 25.1 | 23.4 | 22.6 |
| Away | 23.8 | 22.5 | 21.9 |
| SwStr | 12.6 | 12.1 | 11.7 |
| CallStr | 31.5 | 31.2 | 31.7 |
Overall, strikeouts are up 1.5%, about a 6% increase. This is significant enough to affect game play in all formats.
While relievers still fan batters at a higher
Before delving into the topic at hand, let's put a bow on tracking the home run data. My research shows the home run rate (HR/PA) is predictive after 450 games. MLB reached the milestone earlier this week. As has been the lean, 2021 just a tick ahead of 2017. If the trend holds true, the final HR% should be close to 3.44%. In 2019, it was 3.82% while 2017 finished at 3.29%.
With homers wrapped up, let's turn our attention to strikeouts. One of the early storylines is the spike in punchouts throughout MLB. My hypothesis is if there is a specific subset of pitchers responsible for the increase, we can leverage that information when making moves. This is applicable in season-long formats with respect to trades and acquisitions, as well as aiding when streaming pitchers. It's also apropos to DFS since strikeouts are such a key component of scoring.
To begin, here is a lay of the land, looking at the season through Thursday's games compared to a similar number of games in 2019 and 2018. I'm not including 2020 since there were so many nuances disqualifying the data.
| K% | 2021 | 2019 | 2018 |
|---|---|---|---|
| Overall | 24.5 | 23.0 | 22.3 |
| Starter | 24.1 | 22.3 | 21.6 |
| Reliever | 25 | 23.9 | 23.2 |
| Home | 25.1 | 23.4 | 22.6 |
| Away | 23.8 | 22.5 | 21.9 |
| SwStr | 12.6 | 12.1 | 11.7 |
| CallStr | 31.5 | 31.2 | 31.7 |
Overall, strikeouts are up 1.5%, about a 6% increase. This is significant enough to affect game play in all formats.
While relievers still fan batters at a higher clip than starters, the gap is closing. However, starters are tossing fewer innings, so the raw number of strikeouts by starters hasn't changed much.
The home/away data is included since the difference has been narrowing, lessening home field advantage. The reason most often cited is that increased umpire scrutiny is helping the accuracy of calls. At least so far this season, the gap is growing again, rendering home field advantage more important, which is most relevant when streaming pitching.
Next up is examining how early-season data compares to final numbers. The difference between final numbers and those above are presented, so a positive number indicates an increase.
| K% | 2019 | 2018 |
|---|---|---|
| Overall | 0.3 | 0.7 |
| Starter | 0.5 | 0.6 |
| Reliever | 0.1 | 1.0 |
| Home | 0.1 | 0.6 |
| Away | 0.5 | 0.8 |
| SwStr | -0.1 | -0.2 |
| CallStr | 0.3 | 0.2 |
Oh joy, we can expect even more strikeouts as the season progresses. It's curious to note swinging strikes drop a bit while called strikes increase. Please note the called strikes shown here are a bit different than what Alex Fast (PitcherList.com) uses for his groundbreaking CSW analysis. Above is simply called strikes per take. Alex fine-tunes his metric.
Other than noting there are more strikeouts at home, there isn't much actionable. To that end, let's get granular and see if there is a specific pitch or type of pitch responsible for the leap in whiffs.
Four-Seam Fastball
| Year | K% | SwStr | CallStr | Sw+Call Str |
|---|---|---|---|---|
2021 | 23.1 | 11.2 | 34.2 | 45.4 |
2019 | 21.7 | 10.3 | 34.2 | 44.5 |
2018 | 20.3 | 9.7 | 34.7 | 44.4 |
OK, now we're getting somewhere, as there are more strikeouts on four-seamers. Here is the average velocity and spin rate on the four-seamers through the same point of the season:
| Year | mph | Spin |
|---|---|---|
2021 | 93.5 | 2311 |
2019 | 93.1 | 2289 |
2018 | 92.7 | 2266 |
Velocity and spin are both up. Perhaps this is a result of the slightly lighter 2021 ball with marginally higher seams. It can't be anything the pitchers are doing to the ball because MLB is cracking down on that (written with tongue firmly planted in cheek).
This data is interesting, but it requires a deeper dive to identify the arms most likely to benefit. That said, there's research out there showing strikeouts correlate with velocity, so it makes sense harder throwers benefit the most.
Two-Seam Fastball and Sinker
| Year | K% | SwStr | CallStr | Sw+Call Str |
|---|---|---|---|---|
2021 | 15.4 | 7.9 | 37.3 | 45.2 |
2019 | 13.3 | 6.9 | 35.0 | 41.9 |
2018 | 12.7 | 6.6 | 35.3 | 41.9 |
Here is another pitch generating more strikeouts, though the rate is still well below that of the four-seam fastball. Even so, pitchers relying on sinking action to induce grounders are fanning more hitters too. For what it's worth, the source I used began pooling two-seamers and sinkers together this season and no longer listed them separately.
Cutter
| Year | K% | SwStr | CallStr | Sw+Call Str |
|---|---|---|---|---|
2021 | 22.2 | 13.3 | 30.3 | 43.6 |
2019 | 20.6 | 12.4 | 29.4 | 41.8 |
2018 | 21.3 | 12.7 | 29.8 | 42.5 |
Hmm, do you see the same pattern I observe? So far, strikeouts are up across the board, making it difficult to unearth specific pitchers. Spoiler alert: Hang in there.
Curve Ball
| Year | K% | SwStr | CallStr | Sw+Call Str |
|---|---|---|---|---|
2021 | 32.2 | 12.6 | 30.6 | 43.2 |
2019 | 31.4 | 12.9 | 32.6 | 45.5 |
2018 | 32.4 | 13.2 | 32.4 | 45.6 |
Note how the K% on the curve is well above that of any pitch examined so far. That said, while it follows the same pattern, the increase is proportionately smaller than found on the other pitches.
Slider
| Year | K% | SwStr | CallStr | Sw+Call Str |
|---|---|---|---|---|
2021 | 32.1 | 16.5 | 29.7 | 46.2 |
2019 | 31.7 | 17.4 | 28.2 | 45.6 |
2018 | 32.2 | 17.1 | 28.9 | 46.0 |
The strikeout data for sliders has been consistent.
Change-up
| Year | K% | SwStr | CallStr | Sw+Call Str |
|---|---|---|---|---|
2021 | 23.1 | 15.8 | 20.9 | 36.7 |
2019 | 21.4 | 15.9 | 20.2 | 36.1 |
2018 | 21.1 | 15.9 | 20.4 | 36.3 |
This is interesting, since off-speed stuff is also generating more punchouts. While it again falls into the bucket of more strikeouts everywhere, there is more to the story. Stay tuned.
Splitter
| Year | K% | SwStr | CallStr | Sw+Call Str |
|---|---|---|---|---|
2021 | 42.3 | 15.8 | 20.9 | 36.7 |
2019 | 31.3 | 15.9 | 20.2 | 36.1 |
2018 | 32.6 | 15.9 | 20.4 | 36.3 |
Before getting too excited, please realize there are very few splitters used in today's game. As will be shown soon, just over 1% of all pitches are splitters.
Now let's group similar pitches together so we can hone in on a type of pitcher to consider for strikeouts.
Hard (Four-Seam, Two-Seam/Sinker)
| Year | K% | SwStr | CallStr | Sw+Call Str |
|---|---|---|---|---|
2021 | 20.7 | 10.6 | 34.6 | 45.2 |
2019 | 19.1 | 9.6 | 33.9 | 43.5 |
2018 | 17.8 | 9.0 | 34.5 | 43.5 |
Breaking (Curve and Slider)
| Year | K% | SwStr | CallStr | Sw+Call Str |
|---|---|---|---|---|
2021 | 32.1 | 15.1 | 30 | 45.1 |
2019 | 31.6 | 15.6 | 30.0 | 45.6 |
2018 | 32.3 | 15.6 | 30.4 | 46.0 |
Soft (Changeup and Splitter)
| Year | K% | SwStr | CallStr | Sw+Call Str |
|---|---|---|---|---|
2021 | 25.1 | 16.4 | 20.4 | 36.8 |
2019 | 22.5 | 16.2 | 19.8 | 36.0 |
2018 | 22.6 | 16.3 | 19.9 | 36.2 |
Your mileage may vary, but I find this intriguing. The biggest increase comes from soft stuff, followed by the heat. Intuitively, I presumed fastball pitchers would provide actionable targets, but maybe not.
Perhaps location reveals something about the jump in strikeouts.
Upper Third
| Year | K% | SwStr | CallStr | Sw+Call Str |
|---|---|---|---|---|
2021 | 27.9% | 12.7% | 23.2% | 35.9% |
2019 | 26.2% | 11.7% | 22.7% | 34.4% |
2018 | 24.1% | 11.1% | 22.3% | 33.4% |
Middle Third
| Year | K% | SwStr | CallStr | Sw+Call Str |
|---|---|---|---|---|
2021 | 15.5% | 10.0% | 59.3% | 69.3% |
2019 | 14.5% | 9.2% | 57.7% | 66.9% |
2018 | 15.1% | 9.1% | 57.6% | 66.7% |
Lower Third
| Year | K% | SwStr | CallStr | Sw+Call Str |
|---|---|---|---|---|
2021 | 30.4% | 14.3% | 24.9% | 39.2% |
2019 | 29.6% | 14.1% | 25.3% | 39.4% |
2018 | 29.9% | 13.3% | 25.5% | 38.8% |
Pitchers working up in the zone are benefiting a bit more, likely by feeding into the "swing hard in case I connect" mentality. It's hard to catch up to a pitch up in the zone, especially with an uppercut swing. To that end, here are the numbers on four-seam fastballs as well as two-seamers/sinkers up in the zone:
Four-Seam, Upper Third
Year | K% | SwStr | CallStr | Sw+Call Str |
|---|---|---|---|---|
2021 | 29.0% | 15.3% | 17.9% | 35.9% |
2019 | 28.9% | 14.6% | 16.8% | 34.4% |
2018 | 26.9% | 13.9% | 16.9% | 33.4% |
Two-Seam/Sinker, Upper Third
Year | K% | SwStr | CallStr | Sw+Call Str |
|---|---|---|---|---|
2021 | 23.5% | 10.3% | 24.9% | 35.9% |
2019 | 18.6% | 7.1% | 23.9% | 34.4% |
2018 | 16.6% | 7.1% | 24.1% | 33.4% |
This is fascinating to me as there is a big increase in strikeouts via sinkers high in the zone. Of course, not many throw a sinker up, as evidenced by this usage chart:
| Year | 4S | 2S/SI |
|---|---|---|
2021 | 59.3% | 14.5% |
2019 | 59.3% | 14.5% |
2018 | 55.4% | 18.8% |
At least so far, location of hard stuff is the same as 2019. Are pitchers throwing off-speed or breaking balls higher than in the past?
| Year | Soft | Breaking |
|---|---|---|
2021 | 21.7% | 16.4% |
2019 | 20.5% | 15.2% |
2018 | 20.6% | 15.2% |
Yeah, intentional or not, pitchers are working higher in the zone with non-fastballs, but is it effective?
Soft (Changeup and Splitter), Upper Third
Year | K% | SwStr | CallStr | Sw+Call Str |
|---|---|---|---|---|
2021 | 11.7% | 5.7% | 21.7% | 27.4% |
2019 | 13.7% | 5.7% | 21.9% | 27.6% |
2018 | 18.6% | 6.6% | 22.9% | 29.5% |
Breaking Balls (Curve and Slider), Upper Third
Year | K% | SwStr | CallStr | Sw+Call Str |
|---|---|---|---|---|
2021 | 34.2% | 7.7% | 34.5% | 42.2% |
2019 | 28.8% | 7.0% | 35.8% | 42.8% |
2018 | 26.4% | 6.8% | 33.7% | 40.5% |
Bingo, we uncovered another area where strikeouts are up: breaking balls high in the zone.
There is a big piece missing, hinted at previously, and that's usage. Here is how pitch distribution has been trending. Perhaps it is a chicken/egg thing, but pitchers are throwing more breaking balls in the upper third with greater success, at least in terms of strikeouts.
| Year | 4S | 2S | CT | SL | CV | CH | SP | Fast | Soft | Break |
|---|---|---|---|---|---|---|---|---|---|---|
2021 | 35.1% | 15.8% | 7.2% | 18.6% | 10.4% | 11.5% | 1.3% | 50.9% | 41.9% | 29.1% |
2019 | 36.2% | 16.2% | 6.5% | 17.6% | 11.1% | 11.0% | 1.4% | 52.3% | 41.2% | 28.8% |
2018 | 35.4% | 19.5% | 5.5% | 16.9% | 10.7% | 10.4% | 1.4% | 54.9% | 39.6% | 27.8% |
Again, this is counterintuitive. All the talk is about velocity, but fastball usage is declining. Meanwhile, both soft and breaking pitches are on the upswing.
Fantasy Repercussions
The key to maximizing this data for fantasy purposes is identifying pitchers with potential to outperform initial expectations. Granted, it appears the league-wide approach to swing for the fences permeates all offerings, but there are a few areas on which to focus. That said, there is a ton of data here and to be honest, I haven't digested everything yet. As such, here's the plan. I'll end with a quick summary, then spend some time this week thinking it through. Next week, I'll discuss some specific pitchers, or perhaps types of pitchers, to target the rest of the season. This way, the relevant hurlers will garner another start or two so their characteristics are a bit more trustworthy, and hence actionable.
Summary
- Relievers still fan more hitters than starters, but starters are closing the gap
- After a couple of years with declining home field advantage, strikeouts are back up at home
- Velocity and spin rate of four-seam fastballs are up
- The K% for breaking pitches hasn't increased much, but the use of the curve and slider is greater
- Relatively speaking, strikeouts on off-speed stuff have increased more than on heat
- Strikeouts are up in the lower, middle and upper third of the zone, with the largest increase in the upper third
- Curiously, strikeouts on high two-seamers and hard sinkers have increased at a greater clip than high four-seamers
- Despite their increased effectiveness, at least in terms of strikeouts, fewer sinking fastballs are being thrown up in the zone
- More off-speed and breaking pitches are being thrown in the upper third with curves and sliders especially effective at inducing many more strikeouts