It's been a few weeks, let's check in on the run-scoring environment and the associated metrics. The measurement will be in three-week intervals with a two-week overlap. For example, Period 1 is the first three weeks, Period 2 is weeks two through four, etc.
Data from 2018, 2019, 2021 and 2022 are examined. Since the seasons don't start at the same date, I had to decide whether to match up the dates or just start each year at Week 1. Remember, the lockout delayed the start of the current season.
There are advantages and disadvantages of both approaches. I decided to start each year as close to the second week of April, omitting the first week of 2018, 2019 and 2021. This way, weather patterns should be less of a variable. The downside is the runup to the first week in the study is different for each season. That said, it would be different, regardless. Well, 2018 and 2019 were normal, but 2021 followed the pandemic season and things were a bit different. Obviously, the lockout skewed the 2022 exhibition season.
With that as a backdrop, here are the graphs for runs, home runs, wOBA, BABIP, strikeouts and walks.
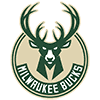
Generally, scoring piggybacks temperature and humidity. This will be easier to see looking at the whole season. Currently, we're still amid the hottest segment of the season, which makes the trend to date quite curious. Scoring peaked in period 8, where it was higher than 2018 and 2019. This corresponds to
It's been a few weeks, let's check in on the run-scoring environment and the associated metrics. The measurement will be in three-week intervals with a two-week overlap. For example, Period 1 is the first three weeks, Period 2 is weeks two through four, etc.
Data from 2018, 2019, 2021 and 2022 are examined. Since the seasons don't start at the same date, I had to decide whether to match up the dates or just start each year at Week 1. Remember, the lockout delayed the start of the current season.
There are advantages and disadvantages of both approaches. I decided to start each year as close to the second week of April, omitting the first week of 2018, 2019 and 2021. This way, weather patterns should be less of a variable. The downside is the runup to the first week in the study is different for each season. That said, it would be different, regardless. Well, 2018 and 2019 were normal, but 2021 followed the pandemic season and things were a bit different. Obviously, the lockout skewed the 2022 exhibition season.
With that as a backdrop, here are the graphs for runs, home runs, wOBA, BABIP, strikeouts and walks.
Generally, scoring piggybacks temperature and humidity. This will be easier to see looking at the whole season. Currently, we're still amid the hottest segment of the season, which makes the trend to date quite curious. Scoring peaked in period 8, where it was higher than 2018 and 2019. This corresponds to May 26 through June 15, which seems like an odd time for runs to spike. As we go through the remaining charts, let's focus on where each metric landed in Period 8.
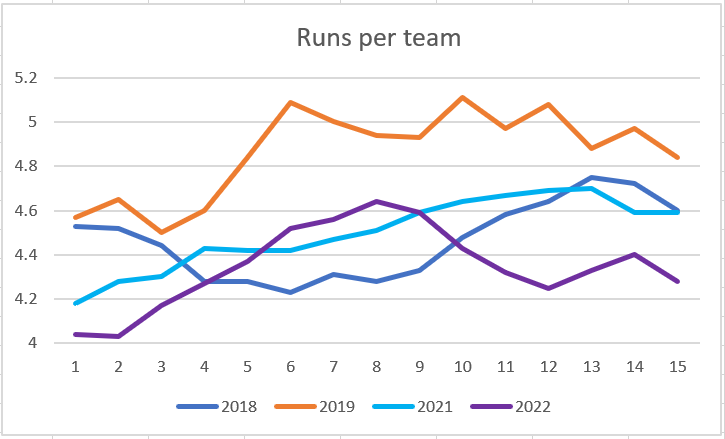
Home runs didn't peak in Period 8, but they were on the upswing. Homers spiked the next period and essentially held steady, before beginning a descent during the time of season they usually increase. It appear long balls could be on another climb, but we'll have to wait a month or so to find out what transpires.
Homers usually correlate well with runs. For some reason, this wasn't the case in 2018 as demonstrated by the following correlation coefficients.
| 2018 | -0.13 |
| 2019 | 0.93 |
| 2021 | 0.73 |
| 2022 | 0.81 |
Homers stayed fairly steady in 2018, but runs increased. This season, both are heading south when temperatures usually send them north. The mercury is certainly rising, as can be illustrated by the beads of sweat dripping from my non air conditioned brow over the past few weeks.
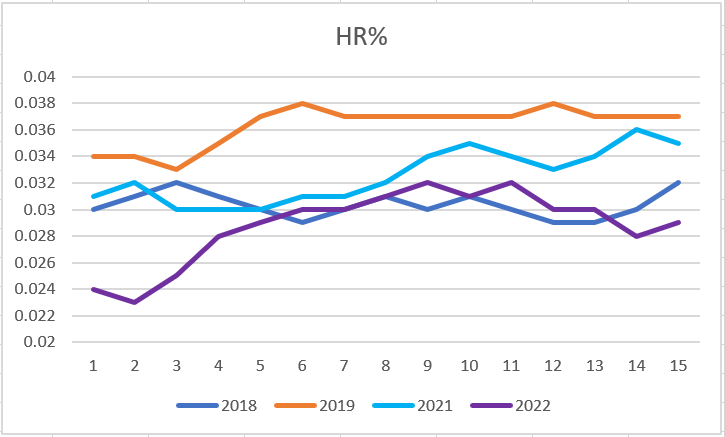
Weighted on base average (wOBA) is an excellent indicator for scoring. This season is following suit, as shown by these correlations between runs and wOBA:
| 2018 | 0.81 |
| 2019 | 0.94 |
| 2021 | 0.96 |
| 2022 | 0.91 |
It's interesting how wOBA has clustered close to the same point at this time of the season in the previous years studied, but this year it has fallen short. Currently, this is just an observation, but it's worth tracking the rest of the campaign.
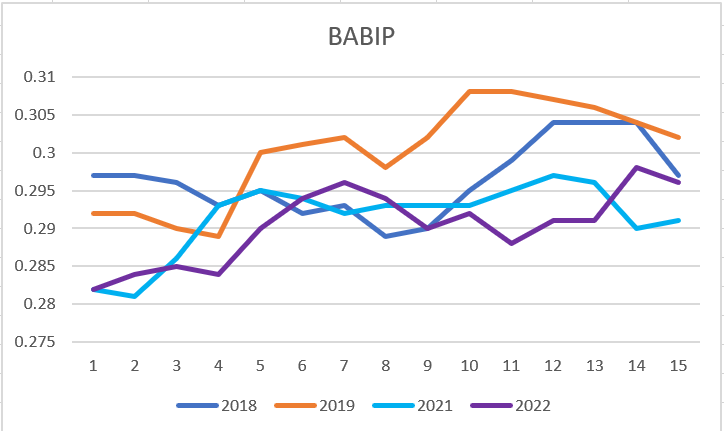
For the second straight season, BABIP started extremely low, then quickly rose to a more typical level. This fascinates me and deserves its own treatment by parsing BABIP into groundball, line drive and flyball components. This is the area most affected by the shift, so any conclusions will need to be considered in conjunction with how legislating the shift may alter outcomes.
I'm not 100 percent there is a clear cause and effect from increasing use of the shift, but it's interesting how the correlation between BABIP and runs is dropping:
| 2018 | 0.91 |
| 2019 | 0.88 |
| 2021 | 0.80 |
| 2022 | 0.71 |
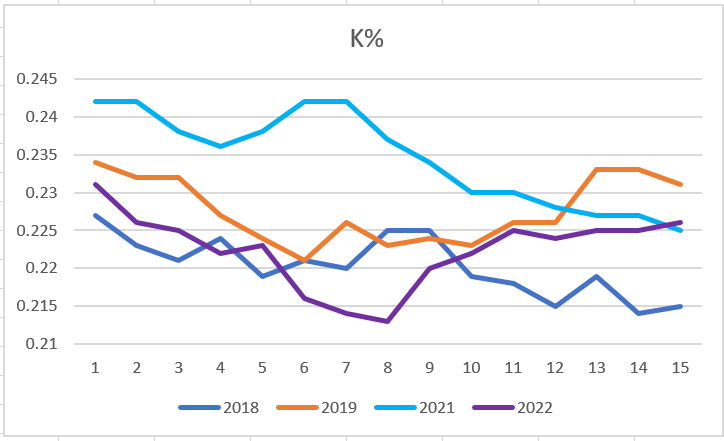
This is quite interesting. Look at Period 8. Strikeouts were on the decline, hitting their 2022 nadir at the same time runs were at their apex. Coincidence? I think not. The question is if the increased contact was by design or happenstance. At the time, it appeared players were adjusting to the ball and its reduced flight. However, as quickly as the strikeout rate fell, it climbed and now seems to have leveled off. Still, isn't the fact run scoring was at its peak while strikeouts were lowest telling? I don't know, maybe putting the ball in play is good? Let's check out the K% to runs correlation.
| 2018 | -0.57 |
| 2019 | -0.62 |
| 2021 | -0.83 |
| 2022 | -0.86 |
Well, look at that. Making more contact is becoming increasingly important during the time putting the ball in the air is all the rage.
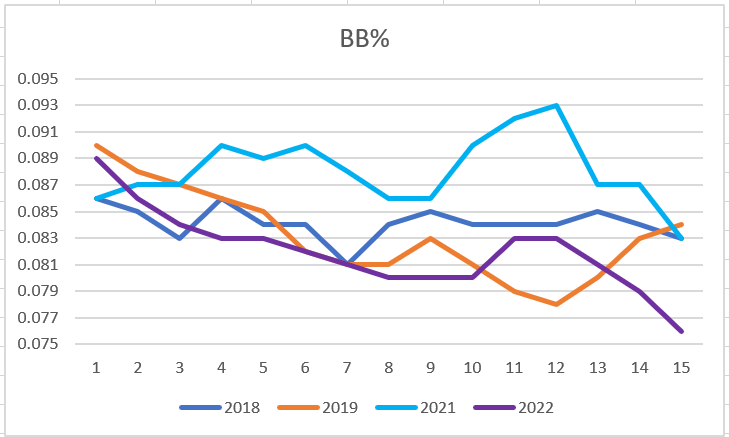
Walks are usually the most random of all the metrics related to scoring. The universal DH is also skewing things a bit this season, as the drop in intentional walks should lower walk rate. It didn't start that way, but pitchers have exhibited increasingly better control as the season has progressed.
Something not mentioned so far is the league continuing to enforce grip enhancers while adjusting the manner in which the balls are rubbed down before the game. Again, suggesting cause and effect is speculative, but there is likely some reason for walks to be dropping.
Here is the correlation between walks and runs:
| 2018 | 0.11 |
| 2019 | -0.86 |
| 2021 | 0.28 |
| 2022 | -0.65 |
Sometimes more walks lead to more runs (2018 and 2021). In 2019 and this season, walks and runs have a strong negative correlation. In 2019, with the happy fun ball, it behooved batters to swing for the fences, perhaps expanding the zone. It's not obvious why a lower walk rate has resulted in more runs so far this season, but the variance speaks towards the randomness of free passes and their limited predictive powers.
Thus completes the trek through factors influencing scoring. Admittedly, there isn't a ton here applicable to managing your team down the stretch, but we have you well covered elsewhere on the site. As baseball fans, it's fun and intriguing to monitor elements of this nature. As someone who projects performance, I'll look at the final comparisons to discern of there are any actionable trends to help refine player expectations.