Everyone knows we're innocent until proven guilty. What is the fantasy baseball equivalent? Is it productive until proven non-productive, or non-productive until proven productive?
It's all about proof. There was a time that single-league auction formats using 4x4 scoring and no reserves were the standard. Those playing the game since its inception have been trained to require evidence before making a significant move. The main reason for that was the league setup; moves had more consequences, and the supply from which to choose was sparse, so you had to get it right.
However, the landscape has changed. Mixed league player pools have much less penetration. Most formats have reserve lists, where speculative plays can be stashed. If you wait for proof, you'll never pick up a difference maker since others are going the Baskin Robbins route and grabbing the flavor of the week.
Even so, most of us want a reason to pick a guy up. Several years ago, I (and others) thought we found the secret sauce. Stability points came into vogue, but as it turns out, the label was a misnomer.
A loose definition of a stability point is the point at which the signal-to-noise ratio within a sample is even. If there is a 50 percent chance the new skill is real, regressing the new level 25 percent towards the projected level yields an adjusted expected level. Over time, the ratio tips more to skills, and the regression increases.
Unfortunately, this is a misapplication of stability points.
Everyone knows we're innocent until proven guilty. What is the fantasy baseball equivalent? Is it productive until proven non-productive, or non-productive until proven productive?
It's all about proof. There was a time that single-league auction formats using 4x4 scoring and no reserves were the standard. Those playing the game since its inception have been trained to require evidence before making a significant move. The main reason for that was the league setup; moves had more consequences, and the supply from which to choose was sparse, so you had to get it right.
However, the landscape has changed. Mixed league player pools have much less penetration. Most formats have reserve lists, where speculative plays can be stashed. If you wait for proof, you'll never pick up a difference maker since others are going the Baskin Robbins route and grabbing the flavor of the week.
Even so, most of us want a reason to pick a guy up. Several years ago, I (and others) thought we found the secret sauce. Stability points came into vogue, but as it turns out, the label was a misnomer.
A loose definition of a stability point is the point at which the signal-to-noise ratio within a sample is even. If there is a 50 percent chance the new skill is real, regressing the new level 25 percent towards the projected level yields an adjusted expected level. Over time, the ratio tips more to skills, and the regression increases.
Unfortunately, this is a misapplication of stability points. The key to understanding this is the fact that the ratio may reach 50 percent in any particular sample, but that stability is independent of the next similarly sized sample. It's descriptive, not predictive.
Looks like it's back to the drawing board.
Even though this clarification was made public over 10 years ago, stability points are still misused. Furthermore, I have yet to find an alternate process which can be used to achieve a similar result. While I am versed in statistics, a project of this nature is out of my lane.
Gathering "proof" is essentially impossible without having a comfortable feel for when a new skill level has predictive ability. This is as true for traditional metrics like strikeout and walk rates as it is for the newfangled variety like hard-hit rate, barrel rate, and the like.
"Descriptive, not predictive" is a common term when using advanced metrics. We can often reverse engineer what happened, but doing so doesn't help unveil what will transpire.
OK, in lieu of proof, what about circumstantial evidence? Knowing what happened in certain scenarios could generate a framework for the future. What follows is the thought process, and results of a study, which sets the groundwork for follow-up research.
Given that stability points can't be utilized in the manner we'd like, there must be something to the contact rates a batter exhibits in one of the smallest samples, usually between 60 and 100 plate appearances, depending on the method. Intuitively, it makes sense that contacting the ball is one of, if not the, truest batting skill. The noise could come from the quality of opposition, weather conditions, and batter's eye in specific parks, among other factors.
The study compares a batter's strikeout rate over the first month of the season to their expectation. What happened over the next five months? Did improvement spawn continued improvement? Was a decline maintained over the entire season?
As a starting point, 2024 April strikeout rates were compared to the final five months. Last season, there were 247 batters with at least 60 April plate appearances and a season-long total of at least 350 trips to the dish.
The hitters were ordered by strikeout rate. A rolling average of nine players was used. That is, the aggregate of the nine highest April rates was compared to the rest-of-season level. This was done for second through 10th, third through 11th, all the way down to the nine lowest strikeout rates. As such, there are 239 data points.
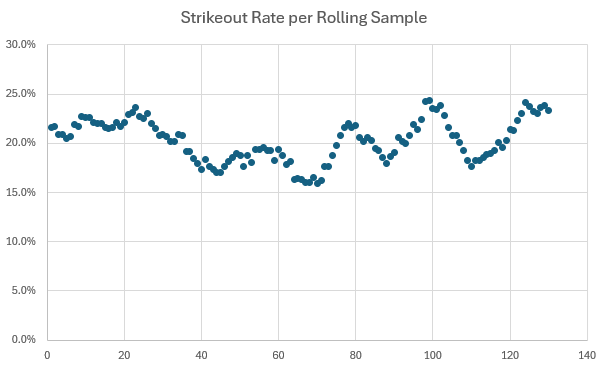
This plot shows the April strikeout rates compared to what transpired the rest of the season:
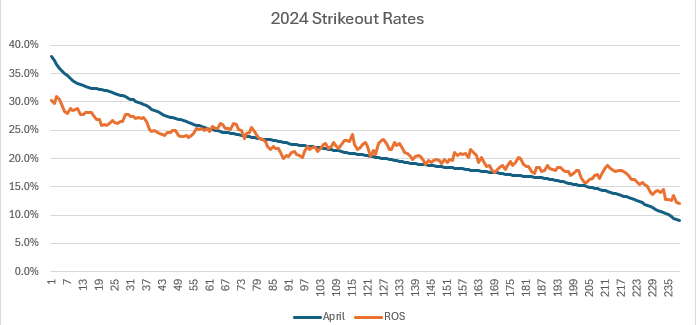
Players who start the season striking out at an elevated pace fan a bit less the rest of the way, but it's still well above average. On the opposite end, those making the most contact continue to make frequent contact, but the rate goes up a bit. Those in the middle stayed close to that level for the final five months.
While having data support intuition is always a good thing, the results ring of, "tell me something I don't know." At the very least, data should hopefully unveil something actionable to help make roster decisions. In a lot of instances, this chart would have been left out, but part of this exercise is to take you through the thought process.
The primary purpose of the study was to get a feel for how changes in April strikeout rate manifest for the rest of the season. Instead of looking at April strikeout rates, the focus shifts to changes from expected to actual.
Of the previous 239 subjects, 140 recorded at least 300 plate appearances each in 2022 and 2023. Their strikeout rate over that period was calculated, and the difference between that and their April 2024 mark was determined. Here, 10 samples comprised the April and rest-of season rolling averages, yielding 130 data points.
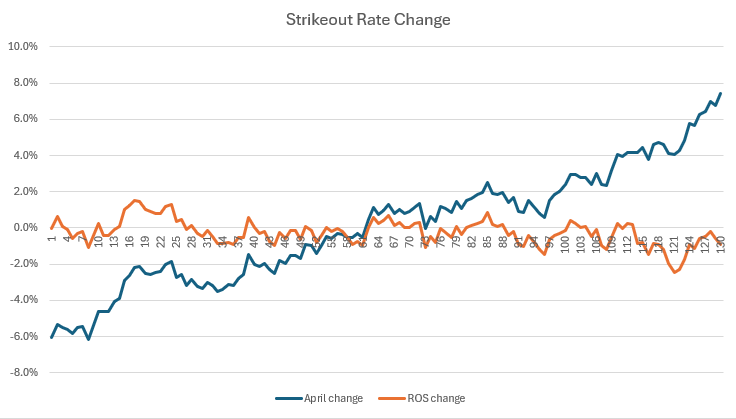
The Y-axis represents the change from expected, where improvement is a positive change and decline is a negative change. As such, the data to the right reflects the players with an April 2024 strikeout rate better than their two-year average. It's ever so slight (the correlation coefficient is -.28) but the rest of season change is in the opposite direction of the April change (hence the negative correlation). That said, the effect is close to random, and since this was just one season's worth of data, drawing conclusions is a slippery slope. Still, it's fascinating (at least to me) that these results fly in the face of the idea that regressing expected to actual would provide actionable information. Simply assuming a reversion to expected seems better.
The next step was as much curiosity as wanting to investigate something specific. A positive six percent change from a player with a low expected strikeout rate was ordered with players with high two-year rates. The higher the rate, the more room for improvement (and vice versa), so the average strikeout rate of each rolling 10-sample data point was added to the mix.
The average of the 130 samples was 20.3 percent with a 2.8% standard deviation. The highest mark is 24.4 percent while the lowest level is 15.9 percent. As before, the data points to the right emanate from the most improved players. Again, it's just a one-year sample, but it appears that the change is independent of the starting point.
To clarify, because this is a personal sticking point with research of this nature, a player with an expected strikeout rate of 15 percent who posted a 10 percent mark in April was assigned the same five percent improvement as a player dropping from an expected 30 percent to 25 percent. To be honest, this could be a flaw in the process. It depends on the context. That said, as will be discussed, it's fixable.
Circling back to the thought process, those reading between the lines may know where this is going. Comparing the change between players punching out at a clip well above average and well below average doesn't feel right, regardless of how it is determined. It was decided to reorganize the 130 samples contributing to the April versus rest-of-season analysis.
Instead of lumping all 140 players together, the pool was divided in thirds:
- The lowest 47 two-year strikeout rates
- The middle 46
- The highest 47
The studies were conducted in the same manner as before, using a nine-player rolling average. The players within each subset were ordered by their change from expected to annual (which helps alleviate the issue just described).
Let's start with the 47 highest expected strikeout rates.
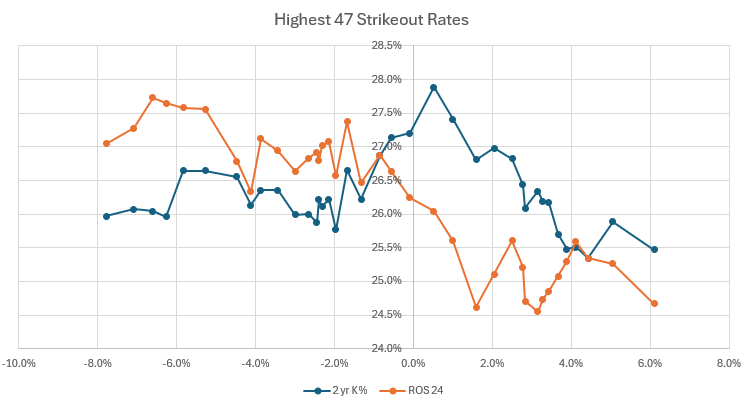
By means of reminder, the data to the left reflects the players with the steepest decline with the points to the right courtesy of the batters exhibiting the most improvement. The Y-axis in the middle shows the aggregate strikeout rate of each data point.
It appears the premise of the stability study was right for the wrong reasons, at least for players with the highest projected strikeout rates. Players fanning more than expected in April continue to do so over the rest of the season, while those demonstrating early improvement tend to sustain their gains over the final five months.
Maybe this is obvious, but be wary of high strikeout players showing early decline but buy into high strikeout guys displaying early improvement.
Let's jump to the other extreme and check out the 47 players coming into 2024 with the lowest projected strikeout rates.
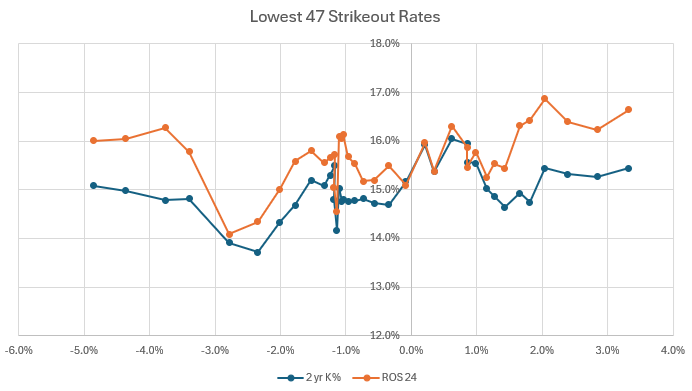
There is no inflection point with this data set. Players with the lowest expected strikeout rates will all fan a bit more than projected, irrespective of their April performance. This information could be just as relevant to initial projections as it is to in-season analysis. That said, the change is usually less than one percent, which will barely move the batting average needle. There is more variance with BABIP than over-projecting a strikeout rate by around one percent.
The take home message here is don't trade for a low strikeout batter because he's fanning less. trade for him because he doesn't strike out much; don't assume he's going to make even more contact.
Let's finish up with the middle 46.
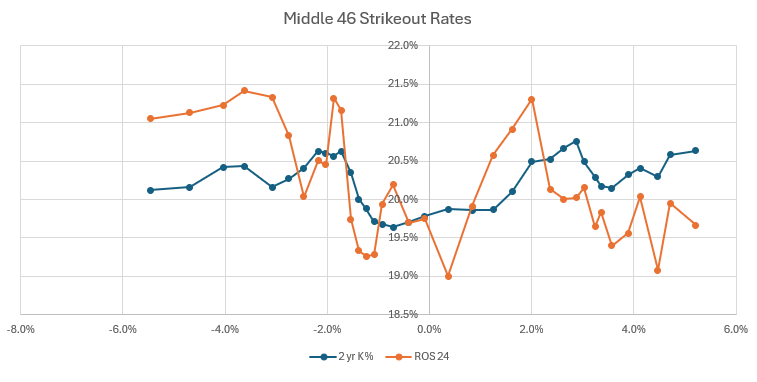
The graph more closely resembles the highest 47 rates, but the delta for each data point here is smaller. Based on the results from the other two studies, it follows that players with an expected strikeout rate a bit above average will maintain their change, just not to the same extent as the high strikeout rate set. Meanwhile, those with a strikeout rate a bit below average will finish the season with an ever-so-slightly higher than projected rate.
As the expression goes, this is just the tip of the iceberg. The elegance of a study of this nature is once the spreadsheets are coded, it's straightforward to drop in data from previous seasons, or ensuing months. Looking at April is needed to help make early-season roster decisions, but investigating other months could reveal a lot about the overall variance.
Further, it doesn't have to be confined to strikeout rate. Any rate metric with a single component to the numerator and denominator can be dumped in. For example, walk and home run rates involve simple substitution of walks and homers for strikeouts. Plate appearances as the denominator remains the same. Barrel rate would have the number of barrels in the numerator and batted ball events in the denominator. Similarly, hard-hit rate entails using the number of batted balls with an exit velocity over 95 mph divided by the number of batted balls. Something like BABIP is possible, but it would require recoding of the template to accommodate the more complex BABIP calculation.
Here are my current plans:
- Comparing April results from previous seasons
- Extending it to every month of the season
- Examining Barrel Rate and Hard-Hit Rate in the same manner.
- After each metric study, looking results from April 2025 to help evaluate players. This is next on the Todd-do list. First, I want to run a couple more previous years to smooth the data, then I'll identify some players with interesting early contact rates (then I'll do barrel rate and hard-hit rate).
Those wanting to workshop additions to this study, please share your ideas in the comments.