Four weeks down, 22 to go. The big story is the dearth of scoring, emanating from a marked decline in homers. While the checkpoint is admittedly arbitrary, let's investigate batted ball and plate discipline metrics through Wednesday's action and compare to a similar number of games from previous seasons, leaving 2020 out since the data is skewed.
GENERAL LEAGUE DATA
Season | G | Runs/G | BABIP | HR% | BB% | K% | Contact% | SwStrk% | Chase% |
2022 | 742 | 4.08 | 0.282 | 2.40% | 8.70% | 22.70% | 73.90% | 12.30% | 27.90% |
2021 | 766 | 4.26 | 0.284 | 3.10% | 8.80% | 24.50% | 72.70% | 12.80% | 26.80% |
2019 | 744 | 4.63 | 0.292 | 3.50% | 9.20% | 23.20% | 73.90% | 12.00% | 27.10% |
2018 | 752 | 4.45 | 0.294 | 2.80% | 9.00% | 22.80% | 74.70% | 11.60% | 26.60% |
2017 | 760 | 4.42 | 0.290 | 3.10% | 8.70% | 21.50% | 75.80% | 11.20% | 26.80% |
It's always wise to start with the big picture. Anyone following baseball for the past month is not surprised, but it's still a bit startling to see the numbers. Keep in mind 2022 includes the universal designated hitter, accentuating the drop in offense even more. That said, it does help explain the dip in strikeouts and walks compared to last season.
Everyone is talking about the precipitous drop in homers, so let's start with the other factor: BABIP. Don't fret, we'll discuss the power outage later.
HARD GROUNDBALLS
| Season | G | PA | ExitVel | LaunchAng | BABIP |
|---|---|---|---|---|---|
2022 | 742 | 7448 | 87.8 | -11.3 | 0.231 |
2021 | 766 | 7584 | 87.7 | -11.1 | 0.229 |
2019 | 744 | 7321 | 88.3 | -9.5 | 0.242 |
2018 | 752 | 7812 | 88.7 | -9.9 | 0.254 |
2017 | 760 | 7903 | 87 | -8.5 | 0.245 |
Much like last season, the BABIP
Four weeks down, 22 to go. The big story is the dearth of scoring, emanating from a marked decline in homers. While the checkpoint is admittedly arbitrary, let's investigate batted ball and plate discipline metrics through Wednesday's action and compare to a similar number of games from previous seasons, leaving 2020 out since the data is skewed.
GENERAL LEAGUE DATA
Season | G | Runs/G | BABIP | HR% | BB% | K% | Contact% | SwStrk% | Chase% |
2022 | 742 | 4.08 | 0.282 | 2.40% | 8.70% | 22.70% | 73.90% | 12.30% | 27.90% |
2021 | 766 | 4.26 | 0.284 | 3.10% | 8.80% | 24.50% | 72.70% | 12.80% | 26.80% |
2019 | 744 | 4.63 | 0.292 | 3.50% | 9.20% | 23.20% | 73.90% | 12.00% | 27.10% |
2018 | 752 | 4.45 | 0.294 | 2.80% | 9.00% | 22.80% | 74.70% | 11.60% | 26.60% |
2017 | 760 | 4.42 | 0.290 | 3.10% | 8.70% | 21.50% | 75.80% | 11.20% | 26.80% |
It's always wise to start with the big picture. Anyone following baseball for the past month is not surprised, but it's still a bit startling to see the numbers. Keep in mind 2022 includes the universal designated hitter, accentuating the drop in offense even more. That said, it does help explain the dip in strikeouts and walks compared to last season.
Everyone is talking about the precipitous drop in homers, so let's start with the other factor: BABIP. Don't fret, we'll discuss the power outage later.
HARD GROUNDBALLS
| Season | G | PA | ExitVel | LaunchAng | BABIP |
|---|---|---|---|---|---|
2022 | 742 | 7448 | 87.8 | -11.3 | 0.231 |
2021 | 766 | 7584 | 87.7 | -11.1 | 0.229 |
2019 | 744 | 7321 | 88.3 | -9.5 | 0.242 |
2018 | 752 | 7812 | 88.7 | -9.9 | 0.254 |
2017 | 760 | 7903 | 87 | -8.5 | 0.245 |
Much like last season, the BABIP on hard ground balls (HGB) started out lower than previous campaigns. The logical explanation is improved defensive positioning. This is more than just shifting, since the infield can be better positioned without technically being in a shift.
As you may recall, a decline in batting average was the story this time last year, but home runs were still prevalent, so the degree of concern wasn't as steep. Even so, it's interesting to observe what's transpired with respect to HGB BABIP over the course of the past couple of seasons:
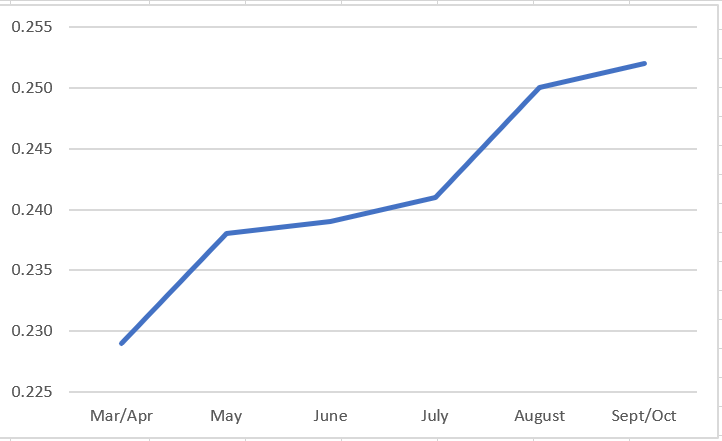
2021 HARD GROUNDBALL BABIP
2019 HARD GROUNDBALL BABIP
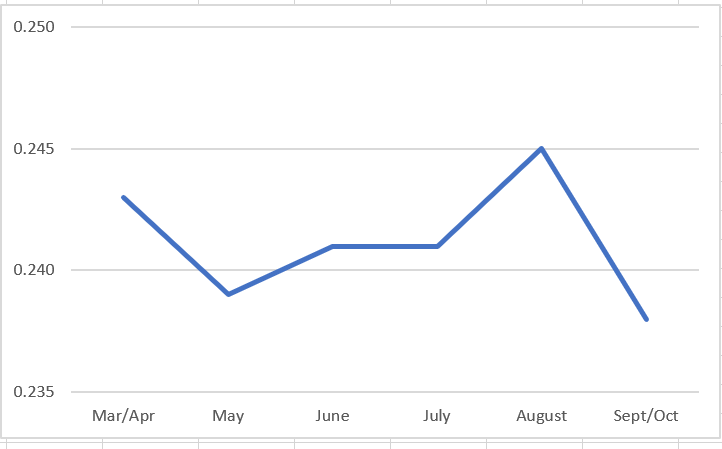
In 2019, HGB BABIP remained consistent, with reasonable variance. Last season, it started low then steadily increased, eventually matching 2019 levels. This does not dictate what will occur the next five months, but it offers optimism for an increase.
SOFT GROUNDBALLS
Over 90 percent of groundballs are hard, but to satisfy curiosity, here is the soft groundball data.
| Season | G | PA | ExitVel | LaunchAng | BABIP |
|---|---|---|---|---|---|
| 2022 | 508 | 497 | 53.6 | -38.9 | 0.157 |
| 2021 | 488 | 432 | 51.4 | -43.8 | 0.171 |
| 2019 | 582 | 671 | 56.9 | -34.5 | 0.186 |
| 2018 | 598 | 662 | 59.3 | -32.7 | 0.189 |
| 2017 | 640 | 868 | 55.1 | -30.7 | 0.181 |
The BABIP is down, perhaps due to positioning, but more likely from variance. Even so, the dip is responsible for some of the overall slide in BABIP.
INFIELD LINE DRIVES
| Year | G | PA | ExitVel | LaunchAng | BABIP |
|---|---|---|---|---|---|
| 2022 | 552 | 534 | 88.8 | 11.5 | 0.152 |
| 2021 | 584 | 539 | 89.1 | 11.8 | 0.113 |
| 2019 | 558 | 527 | 86.1 | 12.1 | 0.152 |
| 2018 | 578 | 569 | 87.6 | 11.4 | 0.228 |
| 2017 | 596 | 622 | 86.6 | 11.7 | 0.248 |
There are relatively few infield line drives, but it's nonetheless interesting to observe the numbers. In full disclosure, I don't know the criteria used for this classification, but since the same database is used for everything, it can be assumed there's consistency within classifications. It appears positioning has not only affected grounders, but infield line drives too. That said, there's nothing here relevant to the general drop in scoring.
OUTFIELD LINE DRIVES
| Season | G | PA | ExitVel | LaunchAng | BABIP |
|---|---|---|---|---|---|
| 2022 | 742 | 3827 | 95 | 17.1 | 0.684 |
| 2021 | 736 | 3633 | 95.2 | 17 | 0.695 |
| 2019 | 744 | 4172 | 94.8 | 17.5 | 0.666 |
| 2018 | 752 | 4083 | 94.8 | 17.2 | 0.678 |
| 2017 | 760 | 4298 | 94.2 | 17.3 | 0.656 |
Two things stand out. First, the average exit velocity for outfield line drives is consistent with previous seasons. This discourages the notion the ball is softer, either by design or as a result of every park using a humidor. That said, it may be that humidors in some venues have increased exit velocity while decreasing it elsewhere, but that's a topic for another day.
The other noteworthy observation is outfield line drive BABIP is within normal variance. This eliminates bad luck in this area as a cause for reduced scoring.
FLYBALLS
I know, finally. Here are the numbers for which you've been clamoring.
| Season | G | PA | ExitVel | Launch Ang | BABIP | Avg Distance |
|---|---|---|---|---|---|---|
| 2022 | 742 | 4697 | 92 | 37 | 0.118 | 313.2 |
| 2021 | 736 | 4461 | 92.6 | 36.6 | 0.124 | 319.3 |
| 2019 | 744 | 4480 | 92.3 | 36.4 | 0.114 | 322.5 |
| 2018 | 752 | 4595 | 92.4 | 35.9 | 0.108 | 315.2 |
| 2017 | 760 | 4431 | 91.6 | 36.4 | 0.111 | 321.1 |
The last column is creating all the fuss. Clearly, the ball is sprouting mini-parachutes, restricting flight. Maybe the exit velocity is down a tad, but the average launch angle is up a smidge, and the higher the ball is hit, the lower the exit velocity.
Taking things back a step, keep in mind average flyball distance is a strong predictor of home runs, research courtesy of Fangraphs' Mike Podhorzer. The average flyball distance is down six feet from last season and over nine feet from the happy fun ball campaign. It stands to reason less flight is lost from shorter flies, while even more distance is missing from longer flyballs. It doesn't take a Ph.D. in common sense to comprehend the precipitous paucity of power.
The cause, however, is still a mystery. It's largely circumstantial, but the reason doesn't appear to be a drop in average exit velocity. This can be tested by determining the coefficient of restitution (bounciness) of the 2022 baseballs. I'd be shocked if that wasn't currently occurring in a laboratory.
The surface of the baseball could be a factor, as could the seam height. Curiously, there have been reports of "dented" baseball, those with flat spots. A perfectly round sphere incurs the least air resistance. Even the slightest deformity would result in reduced flight. Hopefully soon, someone will release a comprehensive study of the 2022 baseball, explaining all these abnormalities.
Some, including your truly, have wondered whether April temperatures could be influencing flyball distance. Weather data from April isn't available yet, but it was indeed colder than normal is some places, but warmer in others. That said, the rule of thumb is the ball travels three feet per 10 degrees increase in temperature, which isn't sufficient to account for the marked drop in flyball distance.
Still, if only to satisfy curiosity, checking out typical flyball distance by month is a worthwhile endeavor.
2021 Monthly Flyball Distance
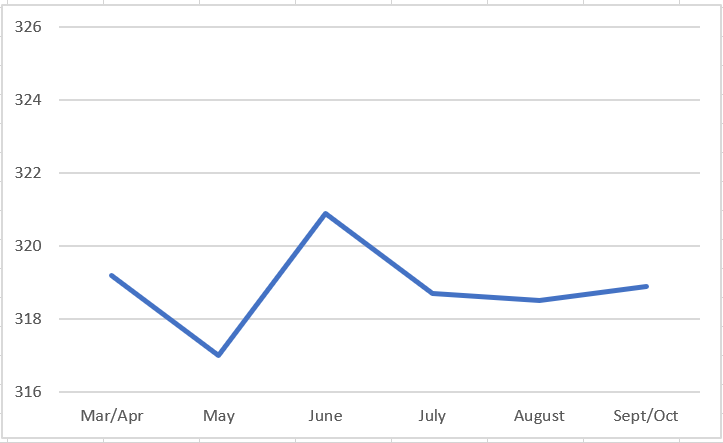
June 2021 was unusually warm, hence the spike to 321 feet, but even so, there isn't the steady increase one may intuit, especially since homers generally increase as the season progresses. However, there were other variables lasts season, including multiple baseballs and midseason legislation for grip enhancement.
2019 Monthly Flyball Distance
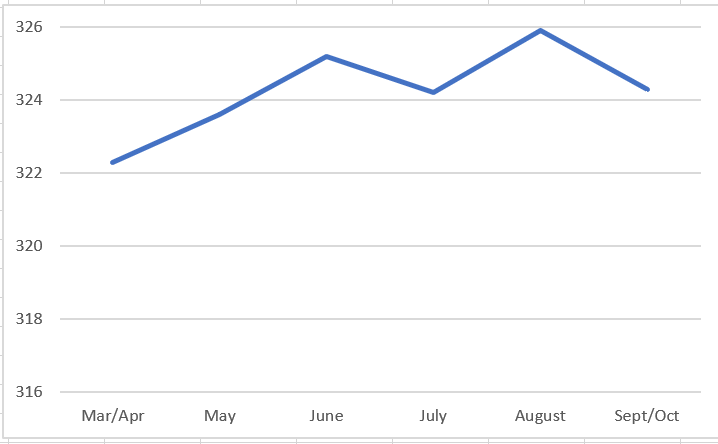
The general trend is upwards, though there are deviations, suggesting there are more factors influencing power than strictly temperatures.
Circling back to the initial flyball table, note the BABIP is consistent with previous seasons. On the surface, this could be expected, but remember homers are not part of the BABIP formula, so a change in BABIP could be explainable via the drop in homers as there would be more balls in play. However, there is no change in BABIP, suggesting the lost homers are landing for hits at the same rate as other flyballs that stay in the yard.
However, home runs are hits too, and while they're not incorporated into BABIP, they obviously are part of overall batting average. Earlier, it was demonstrated some of the drop in league batting average was from a lower hard groundball BABIP, which may or may not recover. The other aspect for the fall is homers -- balls that left the yard in past seasons are not.
This is the part where I'm supposed to recommend hitters and pitchers based on the data. Advice would presuppose no changes are made to the ball. The problem is last season, we learned MLB isn't averse to using multiple baseballs. As such, I'm going to wait on getting granular with player analysis, at least until more is known about the baseball.
Even though the following is always the case, the chief manner in which to combat the drop in offense is to bully hitting. You want as many chances as possible for production. This involves playing matchups with as many options as you can muster. Depending on league rules, this could manifest as tough roster decisions. In leagues with limited reserves and no separate IL, stashes should be minimized since that's one fewer chance to maximize volume. Be it an injured player, a prospect still in the minors, speculative closers or even slumping players, it could be more advantageous to have someone capable of contributing now.
The flip side is that now is the time to more liberally stream pitching. This does not suggest being reckless, but aggressiveness merits consideration since the run-scoring environment is likely to increase. Admittedly, this isn't a comfortable endeavor, but taking advantage of the current landscape could pay dividends. The key is to not be discouraged by one misstep. You shouldn't abandon the approach just because Justin Steele didn't work out. Look for a tangible reason why a pitcher may continue succeeding (increased velocity, new pitch mix) and trust the parachute balls won't be swapped out, at least not yet.