A few weeks back, an installment of this column cautioned both that the super happy fun ball was likely coming back in 2020 and that the overall offensive environment was likely to be lower this season. Only one of those appears to be true to date, and it is not the postulation on the baseball.
We are roughly 15 percent into this season, but it is abundantly clear we are playing in a lessened run environment. The super happy fun ball has not shown up, and offense as a whole appears to have opted out of the 2020 season. The table below shows the league-wide numbers as play began on Aug. 9:
Season | G | PA | HR | R | RBI | SB | BB% | K% | ISO | BABIP | AVG | OBP | SLG | wOBA |
|---|---|---|---|---|---|---|---|---|---|---|---|---|---|---|
2016 | 4860 | 184577 | 5610 | 21744 | 20746 | 2537 | 8% | 21% | 0.162 | 0.300 | 0.255 | 0.322 | 0.417 | 0.318 |
2017 | 4860 | 185295 | 6105 | 22582 | 21558 | 2527 | 9% | 22% | 0.171 | 0.300 | 0.255 | 0.324 | 0.426 | 0.321 |
2018 | 4860 | 185139 | 5585 | 21630 | 20606 | 2474 | 9% | 22% | 0.161 | 0.296 | 0.248 | 0.318 | 0.409 | 0.315 |
2019 | 4860 | 186516 | 6776 | 23467 | 22471 | 2280 | 9% | 23% | 0.183 | 0.298 | 0.252 | 0.323 | 0.435 | 0.320 |
2020 | 410 | 15235 | 505 | 1796 | 1724 | 184 | 9% | 24% | 0.165 | 0.276 | 0.231 | 0.311 | 0.396 | 0.310 |
A 31-point drop in batting average, a 22-point drop in BABIP and a 39-point drop in slugging percentage are noticeable in watching these games while other indicators such as walk rate and strikeout rate remain mostly constant. The per-game rates is where the impact of this shows up:
Season | HR/G | SB/G | R/G | RBI/G |
|---|---|---|---|---|
2016 | 1.2 | 0.5 | 4.5 | 4.3 |
2017 | 1.3 | 0.5 | 4.6 | 4.4 |
2018 | 1.1 | 0.5 | 4.5 | 4.2 |
2019 | 1.4 | 0.5 | 4.8 | 4.6 |
2020 | 1.2 | 0.4 | 4.4 | 4.2 |
Just one year removed from the inflated run environment, we are essentially back to 2018 level of offense, in a year when the sport removed the dead weight of pitchers hitting from the equation!
I do not believe it is any one factor that contributes to this downturn in offense as much as it is a concoction of factors which bring us to where we are are. The issues below are presented in no particular order, but I believe each owns some responsibility in lowering offensive output this year.
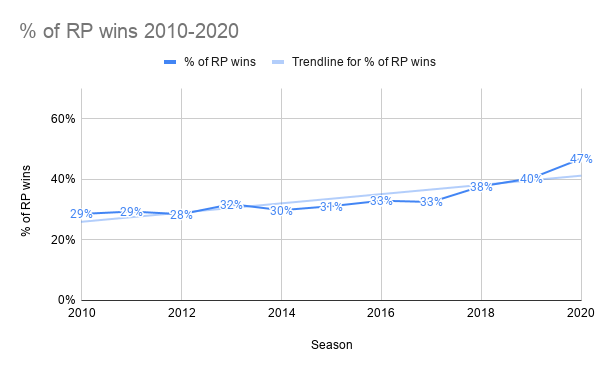
The aforementioned installment mentioned that managers would undoubtedly leverage their extra relievers as rostered were expanded for the first half of the season. The original plan was to have 30-man rosters for two weeks, 28-man rosters for the next two weeks and then 26-man rosters for the second half of the season. That plan has since been adjusted to where we will have 28-man rosters for the rest of the season, and managers are enjoying the new tools.
Relief pitchers currently have 47 percent of wins in the league as managers are taking advantage of the extra arms with a quicker hook.
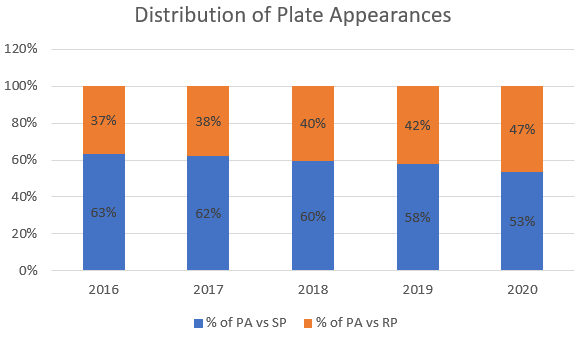
The times through the order penalty is being addressed through this process batters are seeing the same pitcher in three consecutive at bats less often in 2020 than they did in 2019:
Season | Time Thru Order | TBF | AVG | OBP | SLG | BABIP | HR/FB | % of PA |
|---|---|---|---|---|---|---|---|---|
2019 | 1st | 117605 | 0.245 | 0.321 | 0.419 | 0.294 | 15% | 63% |
2020 | 1st | 10442 | 0.222 | 0.307 | 0.377 | 0.271 | 13% | 69% |
2019 | 2nd | 44046 | 0.263 | 0.325 | 0.456 | 0.298 | 16% | 24% |
2020 | 2nd | 3576 | 0.248 | 0.321 | 0.426 | 0.282 | 15% | 23% |
2019 | 3rd | 23999 | 0.270 | 0.330 | 0.474 | 0.302 | 16% | 13% |
2020 | 3rd | 1197 | 0.253 | 0.322 | 0.468 | 0.280 | 17% | 8% |
Nearly 70 percent of plate appearances this season recorded by pitchers have come in a single trip through the lineup. The second time through percentage has held true, while the third time through has dropped to a single digit percentage for the first time. Starting pitching, on the whole, is barely lasting two time through the lineup in 2020:
Season | TBF | G | BF/G |
|---|---|---|---|
2016 | 116837 | 4856 | 24.1 |
2017 | 114870 | 4860 | 23.6 |
2018 | 110468 | 4862 | 22.7 |
2019 | 107495 | 4858 | 22.1 |
2020 | 8120 | 410 | 19.8 |
One might believe pitchers are airing it out more knowing they do not need to conserve their energy for 100-plus pitch outings, but the average pitch velocity for the first two times through the order does not back up that theory.
We do, however, see that managers not named Terry Francona are not leaving their starters out there for too long. The average number of batters faced per game is on pace to drop for a fifth consecutive season, and it would take a modern miracle to undo the trend we're seeing as relievers are now responsible for a higher percentage of recording outs than in any previous season:
What this leads to is batters facing three to five pitchers in a single game. That is multiple scouting reports and looks to adjust to within the same game, without the benefit of modern technology an arm's length away from hitters. Thanks to all the recent scandals during the past few years as well as the current pandemic, MLB has leveled restrictions on what teams have access to in-game, and players are not happy.
Part of the operations manual for this season explicitly states, "use of any communal video terminals is prohibited." This impacts game prep as well as in-game use of equipment back in the tunnel that provided instant feedback on their swings from multiple camera angles. Players now have personal iPads to study video of the opposing pitcher, but it is more of the highlight point-of-view rather than the enhanced breakdown hitters are accustomed to from the more advanced systems in clubhouses and tunnels in previous seasons. That, combined with the pitchers putting in serious work during spring and summer camp, gives the pitcher the high ground in 2020 from the mound. There are more new pitches being worked on and thrown this year than ever before, and hitters have limited access to the same video tools which has allowed them to keep pace in recent seasons.
We also see more batted balls being converted into outs this year, as the league-wide BABIP, which always hovers at .300, is down in the .270s. A low BABIP to start the season is not unusual, as that is typically the case each year, thanks to the early-season cooler weather:
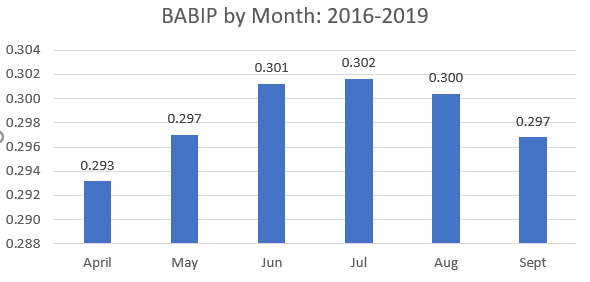
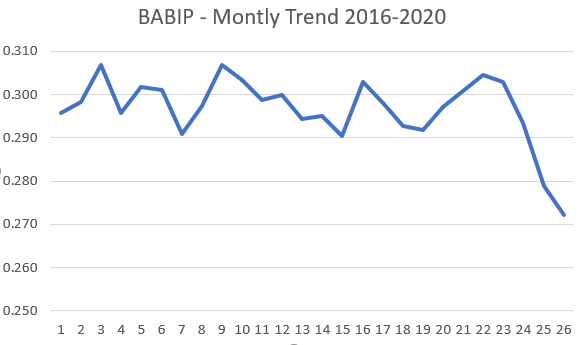
We are still in the first month of 2020 play, so the low initial baseline is not surprising as much as how low it is given the time of year. The month-by-month trend shows just how far we are into uncharted territory:
The immediate thought is to look at any changes we have happening defensively around the league to see if new strategies may be to blame for this. At a high level, the answer is yes, as there has been a dramatic change in the volume of shifts being applied in 2020:
Season | Shift% | vs RHH | vs LHH |
|---|---|---|---|
2019 | 26% | 14% | 42% |
2020 | 35% | 22% | 52% |
Difference | 38% | 57% | 24% |
The league has become uber-aggressive in shifting in 2020 overall, especially against righties as more teams are willing to apply the overshift to the left side. In all, 24 of the 30 clubs are shifting more frequently this season than last season, and a few stand out in the group:
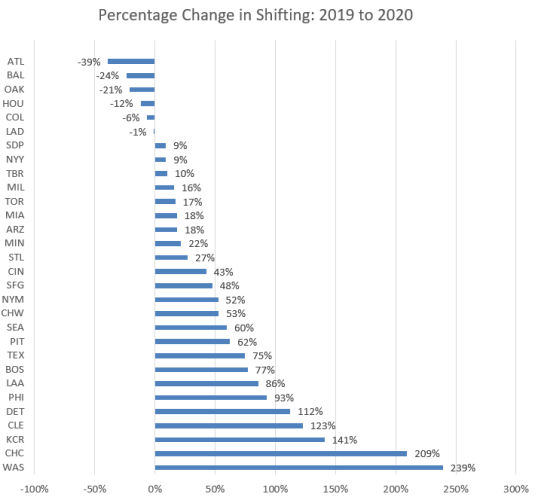
Heck, even Mike Matheny is getting in on the game and moving the Royals around like rarely before, but also interesting to see the defending world champs leading the league in shifts this year.
The BABIP by handedness paints a more clear picture of what we are seeing:
Season | RH BABIP | LH BABIP | RH BABIP SFT | LH BABIP SFT |
|---|---|---|---|---|
2016 | .302 | .297 | .314 | .300 |
2017 | .300 | .299 | .309 | .296 |
2018 | .296 | .295 | .306 | .296 |
2019 | .299 | .297 | .302 | .298 |
2020 | .288 | .259 | .278 | .255 |
Righties are not being as penalized by the shift as their lefty brethren. Righties are being shifted more frequently, but it's the lefties which have seen a 38-point drop in BABIP overall, and a 43-point drop when they're shifted in any manner. Lefties make up 42 percent of the overall plate appearances league-wide, so that volume is going to do it's work to drag down the overall league BABIP.
The increased emphasis on shifting could be the league's way of setting up the increased roster size for success given pitchers with marginal major league ability are being asked to record a volume of outs this year, and have to do so while facing a minimum of three batters within an inning. It is just one of the factors we are witnessing in this laboratory of a season where teams are doing whatever they can do to squeeze the most out of the names they have on their roster. We, as fantasy players, need to adjust our expectations for offense the rest of the season as it is apparent we are taking a step backward from the action we saw in 2019.