I'm paraphrasing, and perhaps misremembering the author of the tweet -- I'm pretty sure it was Tom Tango, but it may have been Russell Carleton -- who wrote something like, " 'It's a small sample' and 'but' should never be in the same sentence."
Unfortunately, most everyone missed the memo, especially those paid to talk and write about baseball. That said, there are some small sample indicators with a track record of being predictive, such as early-season home run data. Friend and colleague Jason Collette discusses what's happening this season in a recent Collette Calls. My research relies on the first three weeks of the season to project what's to come, but we're only halfway there. Still, it doesn't hurt to look at what's happened so far, from a descriptive basis. We'll also check out what's happening with BABIP and steals.
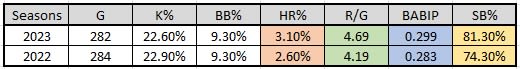
First off, here's a look at the big picture, through Sunday's games, with a comparison to last season's first three series.
Home Runs
Let's start with homers by series, with the second series being Monday through Wednesday, even though some ended Thursday. The key to this data is Mike Podhorzer from Fangraphs has shown a significant correlation between average fly ball distance and HR%. Looking at the data in total renders a curious outcome:
| Seasons | HR% | HR/FB | FBDst |
|---|---|---|---|
| 2023 | 3.10% | 10.20% | 315.9 |
| 2022 | 2.60% | 9.00% | 316.2 |
There is a disconnect between the average fly ball distance and HR%. Here is the data by series:
Note the average fly
I'm paraphrasing, and perhaps misremembering the author of the tweet -- I'm pretty sure it was Tom Tango, but it may have been Russell Carleton -- who wrote something like, " 'It's a small sample' and 'but' should never be in the same sentence."
Unfortunately, most everyone missed the memo, especially those paid to talk and write about baseball. That said, there are some small sample indicators with a track record of being predictive, such as early-season home run data. Friend and colleague Jason Collette discusses what's happening this season in a recent Collette Calls. My research relies on the first three weeks of the season to project what's to come, but we're only halfway there. Still, it doesn't hurt to look at what's happened so far, from a descriptive basis. We'll also check out what's happening with BABIP and steals.
First off, here's a look at the big picture, through Sunday's games, with a comparison to last season's first three series.
Home Runs
Let's start with homers by series, with the second series being Monday through Wednesday, even though some ended Thursday. The key to this data is Mike Podhorzer from Fangraphs has shown a significant correlation between average fly ball distance and HR%. Looking at the data in total renders a curious outcome:
| Seasons | HR% | HR/FB | FBDst |
|---|---|---|---|
| 2023 | 3.10% | 10.20% | 315.9 |
| 2022 | 2.60% | 9.00% | 316.2 |
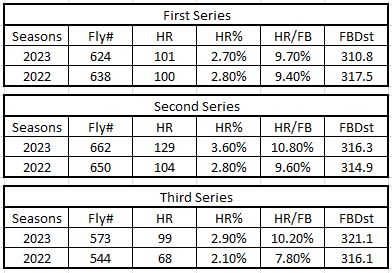
There is a disconnect between the average fly ball distance and HR%. Here is the data by series:
Note the average fly ball distance was almost the same for each series last year but has steadily increased this season. Remember, the campaign started a week later last season, so perhaps it's driven by temperature. For a more detailed discussion on temperature and the flight of the ball, please check out Jason's piece linked above.
Being a Red Sox fan, and still having acute memories of the Baltimore Orioles treating their opening three-game set in Fenway Park like the Home Run Derby, I'm curious if that is skewing the numbers.
| HR% | HR/FB | FBDst |
|---|---|---|
| 5.40% | 17.10% | 324.4 |
Nope, they crushed them, which was my recollection, but it doesn't hurt when data supports aging memory.
For the correlation between average fly ball distance and HR% to hold true, one of two things needs to happen.
- HR% needs to fall
- Average Fly Ball Distance needs to increase
The reason small sample data is unreliable is all of the biases are not fleshed out. That it, small samples are not an accurate representation of larger samples. One reason this is the case here is the first series featured mostly front-end starters. The next two, and all ensuing series, will be composed of a mix of pitchers from different rotation spots.
We'll know more after three more series, but my lean is No. 2 above, in large part because it is already heading there, along with what Jason discussed in his article. Of course, this all depends on the balls MLB delivers to each park and their storage. Not to mention (and Jason discusses this) how the pitch clock affects pitchers and hitters as the season progresses.
Stolen Bases
Tango and Carleton are two of the most influential statisticians contributing to the baseball landscape. However, Bill James knows a thing or two as well, and he teaches us extremes in small samples can be real.
Stolen bases in 2023 have entered the chat.
Of course, it helps there is a tangible cause and effect with the rules changes affecting the running game. Let's check out how steals have trended over the first three series.
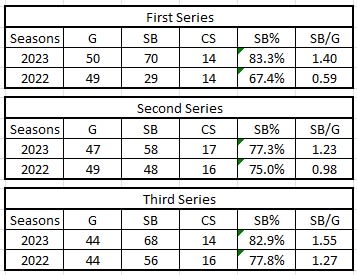
Sample size be damned; pilfers are prospering. Thanks, Lord Obvious.
That said, more so than other stats, matchups drive steals. Look at the third series last season. It would fit right in with this campaign.
We need more data, but we'll soon know which teams can't control the running game. Most are probably thinking Boston, but since Connor Wong took over as the primary backstop, teams are not running quite as wild.
We'll also get a better handle on the subset of runners contributing the most to the spike. Right now, even if it can be pinpointed to a group, it's premature to contend that trend will continue.
BABIP
Before looking at the data, let's try to figure out what should happen with shift legislation.
- Right-handed batters were only shifted 19.5 percent of the time last season, so any differences in righty data is almost assuredly small sample noise.
- Left-handed batter BABIP on hard groundballs and outfield line drives should increase.
Agree? Disagree?
Again, by series, with the respective seasons to date on top:
- HGB: Hard Groundball
- OLD: Outfield Line Drive
- FB: Flyball
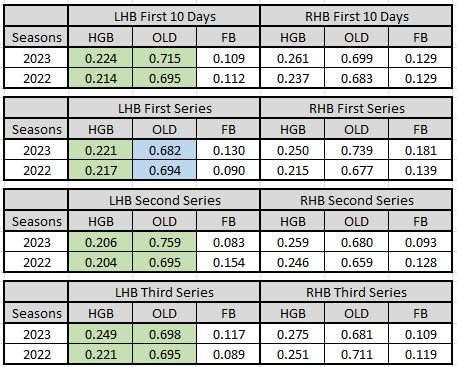
Green represents what is supposed to happen while the blue is contradictory. Upon first blush, legislating the shift is having the desired effect as left-handed HGB and OLD BABIP is up. However, it is also up for right-handed batters. It's not correct to use the lack of a shift as cause and effect for lefty swingers, if righties are showing a bigger gain on HGB and close to the same increase with OLD. Through 10 days, it's variance. Over the course of the season, the right-handed data from this season and last may grow closer, but until it does, it's premature to decree legislating the shift is working as intended.
Between you, me, and the firewall, I suspect that's what will occur (righty numbers normalizing), so all I am saying is hold off on your victory lap but keep in shape because it's likely coming.
Something to keep in mind is the overall increase from both sides of the plate may not be all happenstance. BABIP is historically higher when pitchers are at the disadvantage. This includes favorable counts as well as runners on base. BABIP is higher when pitchers work out of the stretch, plus defenses play differently with runners on base. This isn't enough to account for the 16-point increase in RHB OLD from the first table, but the early season bump in BABIP could be amplified by the increase in traffic.
Clearly, this is a work in progress, and unfortunately there's nothing really actionable with regards to malmanagement of our teams, but it is interesting to peel away the onion. There's just no need for tears, at least not yet.