"Lesson not just karate only. Lesson for whole life. Whole life have a balance."
Mr. Miyagi was a wise man. If he played fantasy baseball, he'd want to know how the new balanced schedule will affect pitching.
To review, the old schedule has every team playing divisional opponents 19 times, the 10 teams from the other two divisions in their league six or seven times and interleague teams three or four times.
The 2023 version will feature 14 games against each divisional foe, six games facing the other 10 teams in your league and a three-game series against each of the teams in the other league, except your geographical rival which you face four times.
Other than the fewer divisional games, the main repercussion of the change is having the opponents of each team match those of their division foes, with the exception of the geographical rival. The home and away nature of the interleague games are different within each division. For example, Aaron Judge and the Yankees have a set in Coors Field while Chris Sale and the Red Sox host the Rockies for their series. Even so, the aggregate opponents for teams within each division is much more balanced than it's been.
From a fantasy perspective, the goal is to discern how the change from 76 to 56 divisional games alters the outlook for teams and players with the different divisions. The driving force is the presumption that the quality of hitters and pitchers in each division
"Lesson not just karate only. Lesson for whole life. Whole life have a balance."
Mr. Miyagi was a wise man. If he played fantasy baseball, he'd want to know how the new balanced schedule will affect pitching.
To review, the old schedule has every team playing divisional opponents 19 times, the 10 teams from the other two divisions in their league six or seven times and interleague teams three or four times.
The 2023 version will feature 14 games against each divisional foe, six games facing the other 10 teams in your league and a three-game series against each of the teams in the other league, except your geographical rival which you face four times.
Other than the fewer divisional games, the main repercussion of the change is having the opponents of each team match those of their division foes, with the exception of the geographical rival. The home and away nature of the interleague games are different within each division. For example, Aaron Judge and the Yankees have a set in Coors Field while Chris Sale and the Red Sox host the Rockies for their series. Even so, the aggregate opponents for teams within each division is much more balanced than it's been.
From a fantasy perspective, the goal is to discern how the change from 76 to 56 divisional games alters the outlook for teams and players with the different divisions. The driving force is the presumption that the quality of hitters and pitchers in each division is different, so individuals can benefit or be hurt by the new schedule.
Seems straightforward, right? Unfortunately, catching a fly with chopsticks is an easier task.
The focus of this discussion is how the new schedule affects pitchers. A down and dirty proxy for quality of hitters faced is wOBA. The problem is, the same wOBA may not represent the same quality of hitter, and this goes beyond correcting for park factors (wRC+ is essentially park-corrected wOBA).
Taking this to an extreme, a batter sporting a .350 wOBA on the Double-A Rocket City Trash Pandas is not the same quality of player as a guy with a .350 wOBA on the Houston Astros. Clearly, the quality of opposition is different.
Applying this to MLB, a .350 wOBA generated in the AL Central is likely not the same as one generated in the NL East. The delta between the divisions is far less than between Double-A and The Show, but it exists and is what we're trying to quantify.
A .350 wOBA can be neutralized via park factors, and a slew of other factors. Friend and colleague Derek Carty's The Bat offers an example of this. Please click on the link if you're curious what can be neutralized.
Most of the elements are easily measured, so the adjustment is routine. (Well, "easily" and "routine" could be understating the complexity.) The biggest issue is to account for the quality of players, be it opposition or teammates. At some point, the quality of other players needs to be incorporated, but the intent of the process is to determine the quality of the player.
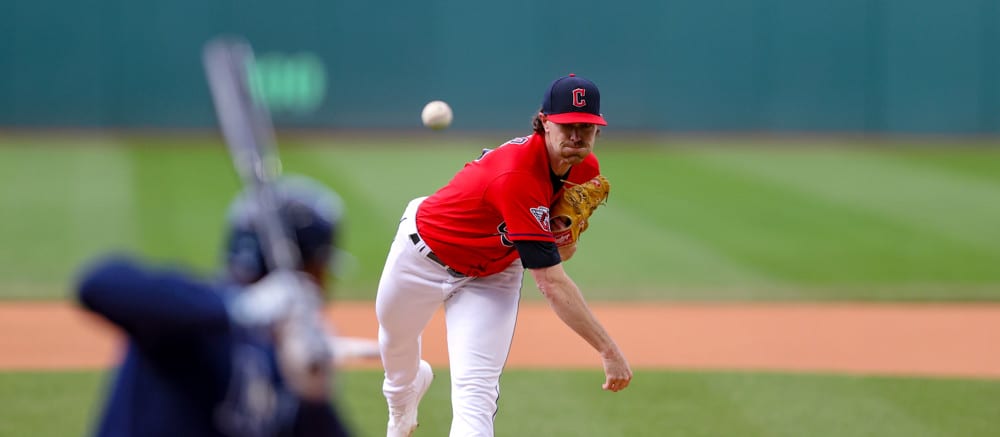
There are probably ways to handle this for which I am unaware, my guess is some sort of iterative process. However, being practical, we're talking about adjusting numbers that have a large amount of variance baked in. Yes, it's important to decide if Shane Bieber should be penalized because he's going to face fewer AL Central teams, but ultimately the adjustment will be subjective, and may get lost in the haze.
With that in mind, here are some numbers. I'll explain how I am adjusting, but the elegance of the process is that everyone can season to taste.
As mentioned, wOBA is a reasonable metric to judge ERA, and to a lesser extent WHIP. Tracking strikeout rate (K%) also makes sense, since not only are strikeouts a category, but it also influences ERA and WHIP.
Here are the aggregate wOBA and K% for the six divisions:
| Division | wOBA | K% | |
|---|---|---|---|
| 1 | AL East | 0.317 | 22.2% |
| 2 | AL Central | 0.302 | 21.3% |
| 3 | AL West | 0.303 | 23.1% |
| 4 | NL East | 0.314 | 22.2% |
| 5 | NL Central | 0.308 | 23.4% |
| 6 | NL West | 0.314 | 22.3% |
This table is more for satisfying curiosity than providing anything actionable. Circling back to the discussion earlier, the batters in the NL East and West recorded the same wOBA, but they're not necessarily of equal quality. Still, the trends match what many would expect.
Cutting to the chase, the pertinent information is the wOBA and K% each team's pitchers faced and how it will differ with the new schedule. Of course, this presumes we know the composition, and quality of each team and divisions -- which we don't.
We can, however, determine what each team faced last season, to a degree. Not every pitcher on the same staff faces an equal distribution of talent. Over the course of the season, teams faced opponents with different players in the lineup, and in varying weather conditions.
One variable for which we can account is home and away. It doesn't account for the weather etc., but it helps flesh out park effects and home field advantage (though smaller samples introduce more variance).
Here is the proposed study. The home and away wOBA and K% will be used to determine what each team faced via weighted average. Here is a streamlined example, using the following schedule for Team GREEN.
| Team Faced | No. Games | Home or Away |
|---|---|---|
| Team BLUE | 3 | Home |
| Team BLUE | 3 | Away |
| Team RED | 1 | Home |
| Team YELLOW | 1 | Home |
| Team PURPLE | 1 | Away |
| Team ORANGE | 1 | Away |
Using wOBA for the example, here are some made-up numbers for the purpose of this exercise.
| Team | Home wOBA | Road wOBA |
|---|---|---|
| Team Blue | 0.319 | 0.323 |
| Team Red | 0.309 | 0.305 |
| Team Yellow | 0.325 | 0.319 |
| Team Purple | 0.314 | 0.311 |
| Team Orange | 0.310 | 0.308 |
The weighted average is
(3 x .323 + 3 x .319 + .305 + .319 +.314 + .310)/10 = .3174
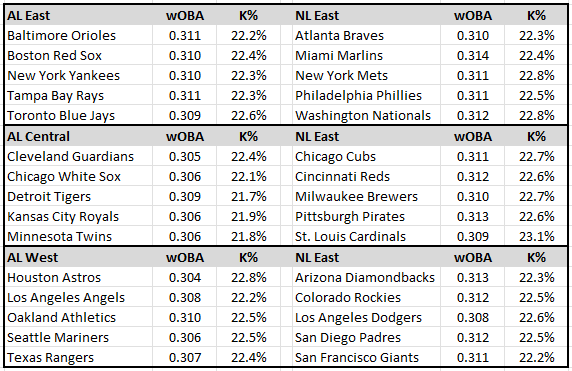
Here are the results for all 30 teams:

Hmm, I'm just not sure how the results can be used to fine-tune pitcher expectations based on the new schedule. Sorry, I'm still stuck on how the quality of offense the Orioles and their .311 wOBA against faced are different than the quality of bats the Mets and their .311 wOBA against encountered.
Let's try this. Earlier, I stated the pertinent information is the wOBA and K% each team's pitchers faced and how it will differ with the new schedule. The former was just presented; now let's address the latter.
We have data based on last season's schedule. What if it were applied to this season's schedule, essentially answering, "What would the wOBA and K% against be if the balanced schedule had been played in 2022?"
Welcome to more fun with weighted averages. There were 76 games played within the division and 86 outside. There will be 56 and 106. What if the same methodology as above was applied to the new schedule, using last season's wOBA and K%? The caveat is the home and away nature of the games isn't known yet, so instead of using splits, the overall wOBA and K% will be utilized, with the presumption the home and road aspect balances out, especially since each team plays all 29 other teams over the course of the season. That is, the chances are small a particular team plays a vast majority of interleague games in extreme hitting or pitching venues or facing very good or very bad hitting; it's most likely a mix.
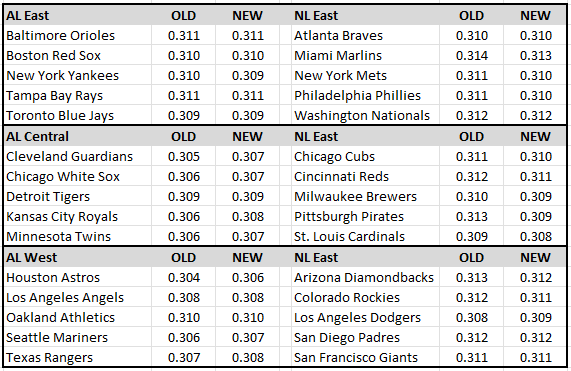
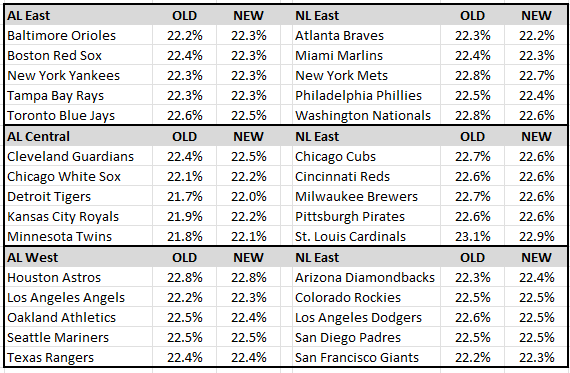
Here are the results, side-by-side, for wOBA and K%.
wOBA

K%

Okay, now we're getting somewhere. Well, sorta. The methodology is a bit crude and entails a couple leap-of-faith assumptions, but if it's trustworthy, the change in schedule barely moves the "quality of opponent" needle.
Some of the clubs would have faced slightly better or worse hitting, but it's at most a .002 difference. Is this worth the worry? From a practical sense, no. If you're on the clock and deciding between an NL East and AL Central pitcher, the lean would be for the NL East, assuming both their previous stats from each league influenced the decision which led to the stalemate.
Should someone generating spreadsheet-driven, formulaic projections code a tweak based on the above? Sure, though the level of the adjustment is a combination of what would have happened last season and the expected strength/weakness of the divisions in 2023. The best free agents have signed, so one can surmise how each division, in the aggregate, has improved or declined from last season. Off-hand, hitting additions by the Mets, Braves and Phillies probably render the NL East even stronger than last season.
Big picture-wise, the issue of trying to solve an infinite loop is mitigated by the fact the end result barely influences 2023 expectations. Perhaps this is counter-intuitive, as the different divisions sure seem to be stronger or weaker than each other, but the key is the difference in the quality of opposition and taking away 20 games within the division just doesn't tip the scales very much.
Disagree? Feel free to sound off in the Discussion section below.


