

One of the greatest things about baseball is its unpredictability. One of my favorite things to do both during the season and the offseason is explore the unexplainable and unpredictable statistics in baseball. There is actually a website for weirdos like myself called You Can't Predict Baseball that serves as the Ripley's Believe It Or Not of baseball. If you are someone who participates on Twitter and you ever see the hashtag #ycpb used by myself or any of the other RotoWire writers, that is what we are referring to. Some examples of #ycpb in 2012 include:
*Fernando Rodney (enough said)
*Juan Pierre hit one home run, off James Shields
*The third-longest home run of the season was hit by Cameron Maybin
*Edwin Encarnacion had as many multi-steal games as Desmond Jennings, Ichiro Suzuki, and B.J. Upton did last season.
*Mike Trout having one of the five best seasons of all-time, as a rookie
The unpredictability of baseball is what makes it a fascinating sport to follow. Even the best fantasy prognosticators and projections are approximately 70 percent accurate in any one season because too many surprises come up over the course of one year. While it is at least twice as accurate as meteorology, there are still things that happen in baseball that nobody sees coming because they happen for no rhyme or reason, as Fernando Rodney proved last season.
The frustrating part about these surprises is they go away as quickly as
One of the greatest things about baseball is its unpredictability. One of my favorite things to do both during the season and the offseason is explore the unexplainable and unpredictable statistics in baseball. There is actually a website for weirdos like myself called You Can't Predict Baseball that serves as the Ripley's Believe It Or Not of baseball. If you are someone who participates on Twitter and you ever see the hashtag #ycpb used by myself or any of the other RotoWire writers, that is what we are referring to. Some examples of #ycpb in 2012 include:
*Fernando Rodney (enough said)
*Juan Pierre hit one home run, off James Shields
*The third-longest home run of the season was hit by Cameron Maybin
*Edwin Encarnacion had as many multi-steal games as Desmond Jennings, Ichiro Suzuki, and B.J. Upton did last season.
*Mike Trout having one of the five best seasons of all-time, as a rookie
The unpredictability of baseball is what makes it a fascinating sport to follow. Even the best fantasy prognosticators and projections are approximately 70 percent accurate in any one season because too many surprises come up over the course of one year. While it is at least twice as accurate as meteorology, there are still things that happen in baseball that nobody sees coming because they happen for no rhyme or reason, as Fernando Rodney proved last season.
The frustrating part about these surprises is they go away as quickly as they appear. Within seasons, long hitting streaks become ugly hitting slumps. Joe Mauer hits 28 home runs in a season and hits 22 combined over the next three seasons. Then you get someone like Wilson Betemit. Betemit is a switch hitter in name only, as he has never really been able to hit lefties from the right side of the plate. Yet in 2010, he hit .312 against them with a .930 OPS only to hit .189 in that split since then in 175 at-bats, while walking just 15 times and striking out 63 times during that span.
I thought it would be helpful to go back into 2012 and look for some more #ycpb moments to see if there were any patterns to their arrival and if the change in numbers is real or just single-season noise that will disappear in a bigger picture.
Robinson Cano versus lefties: Coming into 2012, this was not an issue. In his previous 1,393 plate appearances against lefties, Cano owned a .300/.338/.475 slash line with a five percent walk rate and a 13 percent strikeout rate. He did not show great patience against lefties, but he hit them for average and above average power. Last season, he hit just .239/.309/.337 against lefties in 269 plate appearances. The good news is, he walked a bit more at a seven percent clip, but his strikeout rate also rose five percentage points to 18 percent. This is where sample size comes into play; Cano's splits were rather neutral in every previous season until last season's hiccup.
In terms of Cano, you should be more concerned about his declining flyball rate. From 2006 to 2010, his flyball rates rose each season from 28 to 37 percent. In 2011, that number dropped to 31 percent and last season, it fell to a career-low 26 percent. Despite that decline, Cano became the only hitter from 2002-2012 to have 30 home runs in a season in which they hit so few flyballs thanks to a 24 percent HR/FB ratio. Only Cano and Jacque Jones (in 2006) have hit as many as 20 home runs in a season with a flyball rate of 26 percent or lower so if Cano wants to repeat 30 home runs, he needs to loft more balls in the air because a 24 percent HR/FB rate is unsustainable no matter what park you play in. After all, his previous career high was 17 percent.
Michael Young hitting at home: Young hitting in Rangers Ballpark was pretty much death & taxes territory. From 2003 to 2011, he hit .300 or higher at home and had a slugging percentage over .500 in all but two of those seasons. Then, 2012 happened. In 321 plate appearances at home last season, he hit .261/.312/.325 and hit just one home run after hitting no fewer than eight in any of the previous eight seasons. If you want to look at a reason why the Rangers ended up choking away their lead to Oakland, look no further than the empty at-bats they gave Young all season. The 36-year-old moves over to Citizens Bank Park which is a hitting environment, but not to the extreme that Texas is. Young looked 46 years old last season so despite the massive numbers throughout his career at home, this looks like a case of declining bat speed leading to diminishing returns rather than a single-season anomaly. He should hit more than one home run at home in 2013, but the days of .300/.500 are over.
Russell Martin vs RH Starters: According to his Baseball-Reference splits, Martin has been rather consistent against righties as his average was between .246 and .276 from 2006 to 2011. Last season in New York, that fell down to .190 and his .627 OPS was 30 points worse than any other season for the split. His 2011 and 2012 seasons were nearly identical in terms of plate appearances, but everything else from there differs:
| YEAR | PA | AVG | OBP | SLG | K% | BB% | BABIP |
| 2011 | 306 | 0.246 | 0.317 | 0.445 | 16% | 9% | 0.256 |
| 2012 | 307 | 0.190 | 0.261 | 0.352 | 19% | 8% | 0.202 |
The walk rate was constant, but the strikeout rate went up and he had some awful batted ball outcomes with only 20 percent of his batted balls becoming base hits. His career BABIP vs RH starters is .279, even with last season's totals included so one would have to expect that figure to come up somewhat, as it 54 points lower than his previous career low set in 2011.
Shane Victorino vs righties: Throughout his full-time career, this split has been an odd one for Victorino. For his career, he has a.267/.330/.402 line but in two of the last three seasons, he has struggled. His OPS by season in this split: .755, .733, .767, .787, .681, .787, and .629. If you are a believer in Saberhagenmetrics (from Razzball lore), then Victorino will have a .787 OPS again this season. After all, he did make more contact in this split than he had in the previous two seasons. Yet, he also hit for his worst power in this split in his career as he had but 29 extra-base hits in 472 plate appearances. Some of that is a result of moving from a hitting-friendly park in Philadelphia to a more neutral park in Los Angeles. Victorino may not rebound all the way back to the upper .700's in 2013, but he should be closer to .750 than .650.
Dan Haren vs righties: In his career, Haren has been more successful against lefties than he has righties. His slash line against lefties is .239/.291/.399 while it becomes .266/.297/.416 against righties. Despite the higher slash line against righties, Haren has been a K/BB king against them as he has struck out 5.5 batters for every one that he has walked. Prior to 2012, his highest batting average in this split was .274 while his highest OPS was .745 in a full season of work. Last season, that K/BB rate fell to 3.9, and that slash line morphed into a .320/.343/.482 monster. In 2011, Haren gave up 30 extra-base hits in 394 plate appearances, but in 2012, he gave up just one fewer in just 353 plate appearances with a higher walk rate and a lower strikeout rate. Simply put, Haren was not healthy last season and his inability to finish off his pitches as he has historically done caught up with him in this split. There is still a big "IF" surrounding Haren this offseason, but moving back over to the National League and facing new hitters should help him get back to the Haren we all know and love if he is healthy.
Tim Lincecum vs righties: Like Haren, Lincecum has been rather split neutral for his career. His slash line against lefties is .225/.305/.351, while he has held righties to a .232/.303/.344 line in his major league career. The success against righties up and vanished like a fart in the wind (sorry, I saw Shawshank Redemption for the 300th time this weekend) in 2012 as righties hit .282/.352/.462 against him. That .832 OPS was 150 points higher than other season and it came from a serious drop in strikeouts. From 2009 to 2011, Lincecum struck out three righties for every one that he walked that translated into a 27 percent strikeout rate and an eight percent walk rate. In 2012, he struck out 22 percent of the righties he faced while walking ten percent of them.
Lincecum has thrown 58 percent fastballs, 28 percent breaking balls, and 13 percent changeups when facing righties. In 2012, those percentages changed to 53, 36, and 11 as he worked to adjust his game against declining fastball velocities. The images below show the horizontal and vertical movement on his pitches against righties; the image on the left represents his entire career while the one on the right represents the previous season:
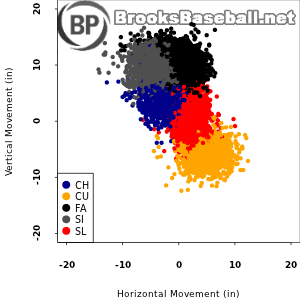
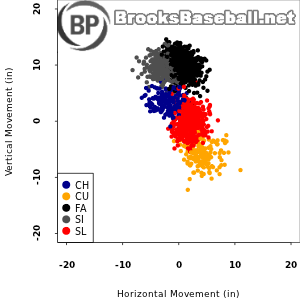
The breaking balls in particular aren't showing as much movement as they did in the past. For his career, righties have slugged .355 off Lincecum's slider and .329 off his curveball according to BrooksBaseball. Last season, those rates jumped to .486 and .435. Historically, those pitches have generated whiff per swing rates in the 30's for Lincecum against righties but the curveball rate fell to 21 percent last season as he struggled to locate it.
Lincecum is quite the paradox because there are some concerning trends in his graphs. While his K/9 continues to remain above league average, his walk rate and thus his K/BB are trending in bad directions as is his home-run rate.


