With Pitchf/x available in some form since 2007, the amount of information about pitchers has increased dramatically. While some information could be extracted about hitters, we could find the velocity, pitch type, and break amounts on every single pitch. Information on hitters has been a little less forth coming, but a couple new pieces of information are now available to help examine hitters: batted ball velocity and hard-medium-soft hit rates.
Some batted ball data has been available over the past 10 years or so like batted balls being divided into line drives, groundballs and fly balls. These values have helped some people to create metrics like HR/FB rate and xBABIP formulas. With the release of Pitchf/x data, where on the diamonda batted ball was fielded became available. Some people, including myself, created rough estimates on home run and fly ball distances.Only so much information on hitters was available to work with, but now new horizons are opening up.
Batted Ball Velocity
Right after Pitchf/x data was available, people wondered why the speed cameras couldn't keep running and detect the speed off the bat. Well, the cameras could and in 2009 a month's worth of data was supplied to the general public and then nothing after that. Some people did some workwith the information to get some baseline information, but with no new data, player information or trends could not be analyzed. Well, the information was available to teams for years, but the general public was left in the
With Pitchf/x available in some form since 2007, the amount of information about pitchers has increased dramatically. While some information could be extracted about hitters, we could find the velocity, pitch type, and break amounts on every single pitch. Information on hitters has been a little less forth coming, but a couple new pieces of information are now available to help examine hitters: batted ball velocity and hard-medium-soft hit rates.
Some batted ball data has been available over the past 10 years or so like batted balls being divided into line drives, groundballs and fly balls. These values have helped some people to create metrics like HR/FB rate and xBABIP formulas. With the release of Pitchf/x data, where on the diamonda batted ball was fielded became available. Some people, including myself, created rough estimates on home run and fly ball distances.Only so much information on hitters was available to work with, but now new horizons are opening up.
Batted Ball Velocity
Right after Pitchf/x data was available, people wondered why the speed cameras couldn't keep running and detect the speed off the bat. Well, the cameras could and in 2009 a month's worth of data was supplied to the general public and then nothing after that. Some people did some workwith the information to get some baseline information, but with no new data, player information or trends could not be analyzed. Well, the information was available to teams for years, but the general public was left in the dark until this season.
Since the start of this season, batted ball velocity has been included with the Pitchf/x information. Baseball Savant.com tracks the data and is a must bookmark for the stats nerds (and others). Before this season, the website had a great searchable Pitchf/x database which had about anything a person could want. And now they have batted ball velocity.
The large number of selection options on the page may seem a little hard to navigate, but have faith. It is worth the time to figure it out. When looking at the batted ball velocity, I recommend starting with this page. It is the amount of batted balls at or above a certain velocity, in this case over 100 mph. From here, a search can be limited to batter handedness or certain game dates.
Now, the big question is what to do with the information?Well, right now the master nerds are just getting their heads wrapped around the information. The biggest issue in the lack of data. It is just a month and half of data after having just a month's worth back in 2009. Sadly, the major advances will likely happen in a couple of years when season-to-season correlations can be calculated.
Well, not all is lost and we can thank Alan Nathan for the help. In the 2014 The Hardball Times Annual, he published the follow graph on the 2009 data. It plots the average batted ball speed and the chance for a hit happening.
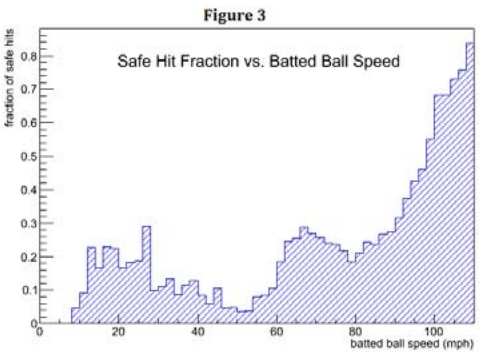
What we see here is that a batted ball around 95 mph has a 50-50 chance of being a hit. By making a few adjustments to the above link to Baseball Savant, here are the leaders in the number of batted balls over 95 mph. The list of players is a good measure of how hard the players are hitting balls.
Here are the top-10 players at hitting balls greater than 95 mph and their batting average on balls in play (including home runs).
| PLAYER | % > 95 MPH | BABIP |
| Joc Pederson | 53 | .439 |
| Yasmani Grandal | 52 | .396 |
| Carlos Peguero | 48 | .394 |
| Hanley Ramirez | 47 | .293 |
| Scott Van Slyke | 44 | .422 |
| Chris Carter | 44 | .263 |
| Justin Turner | 43 | .386 |
| Jimmy Paredes | 42 | .462 |
| Jorge Soler | 41 | .438 |
| J.D. Martinez | 41 | .341 |
Two names stick out on the list as being a bit unlucky, Chris Carter and Hanley Ramirez. Chris Carter has really struggled this season with a .147 AVG. He will normally have a low AVG because of his ~35 K%. In the past few years, when he has hit the ball, he hits it hard. His last three BABIP values prior to 2015 were .369, .337 and .346. This season it is at .250. Carter has been hitting the ball hard, but at people. He looks like a buy low candidate in leagues where he is in play.
Hanley Ramirez could be a buy-high candidate. His 10 home runs are fifth in the majors. He could see an improvement in his .252 AVG if his .207 BABIP starts to regress to his .330 career AVG. I could see owners trying to sell high on the early home runs.
More batted ball velocity information will come out over time on how to use this information and the source to follow on any new information is Darren Willman on Twitter.
Giancarlo Stanton has hit 6 BIP 115 MPH+. Next closest player has 2. Also, only player with 120 MPH BIP. He has 2. http://t.co/XuQGIZGYHU
— Daren Willman (@darenw) May 13, 2015He runs Baseball Savant and seems to have the latest information on batted ball velocities.
Batted Ball Data
While batted ball types like groundballs have been available for years, how hard hit those balls are have not. FanGraphs.com made the information available about a week ago.
Unlike the velocity data, this batted ball information goes back to 2002. The batted balls are classified as Hard, Medium or Soft hit. Here is how the balls are classified:
It's also important to know that prior to 2010, these were all graded visually. From 2010 onward, the batted ball type, hangtime, and distance hit are all used to calculate the soft/medium/hard classifications.
Soft% – Percentage of balls in play that were classified as hit with soft speed.
Med% – Percentage of balls in play that were classified as hit with medium speed.
Hard% – Percentage of balls in play that were classified as hit with hard speed.
With the information, some conclusions can already be drawn. Chad Young took a stab with following conclusion:
Hitters, on the other hand, do seem to have a HH skill. Chamberlain found a correlation of .69, again similar to what others found. This tells us something different – namely that a hitter who is smoking the ball is probably going to keep smoking the ball.
Look at Ryan Braun. He has a 43.6% HH%, 7th highest in the game.His Hard-Medium-Soft split is very similar to Mike Trouts. Yet he has a .264 BABIP and a good-but-not-Braun-like .248/.327/.436 line. But we have reason to believe he'll continue to create a lot of hard contact, which means the overall line should improve as well.
Additionally, Alex Chamberlain has used the new information to createxBABIP and xISO formulas.
Most of the batted ball research is concentrated at FanGraphs.com because the stat is available there. I expect other researchers to begin to use the data and more uses will become available.
It is a generally an exciting time in the fantasy evaluations of hitters as two datasets are now publicly available. Batted ball velocity available at Baseball Savant lets us get down the bare bones of how hard a ball was hit, but the amount of data is limited. FanGraphs has batted balls information which classifies the batted balls classified as Hard, Med and Soft, but the information goes back to 2002. In the next year or two, I expect to see huge jumps in knowledge on hitters as the new data is analyzed in detail.