






I intimated in my last post that I'd be doing for steals this week what I did for blocks last -- which, that's to look at some players who are excelling in the category but also receiving fewer than 20 minutes per game, making them potential targets for the savviest of savvy fantasy owners.
Whether because (a) I've been struck by inspiration or (b) I'm just a Lying Liarface from Liarville, this is, in fact, not what I'll be doing -- so, many apologies to the hundredsthousands millions of readers who hang on this column's every word.
Instead, what I'd like to address this week is an issue that I think causes some difficulty for fantasy owners -- namely, the relative value of increases and decreases in different categories.
Because that's about as awkward a way of describing today's topic as possible, let's use an example instead.
Consider the per-game averages of two incredibly fictional players:
Player A: 19.3 PTS, 0.9 3Pt, 5.5 REB, 3.2 AST, 1.0 STL, 0.7 BLK, 46.6 FG%, 78.3 FT%
Player B: 14.5 PTS, 0.9 3Pt, 5.5 REB, 3.2 AST, X.X STL, 0.7 BLK, 46.6 FG%, 78.3 FT%
We see here two players who're identical in almost every way: three-pointers, rebounds, assists, blocks, field-goal percentage, and free-throw percentage. And though they're not listed here, I can assure you, as well, that Players A and B also take exactly the same number of field-goal and free-throw attempts per game.
So the question, then, is this: How
I intimated in my last post that I'd be doing for steals this week what I did for blocks last -- which, that's to look at some players who are excelling in the category but also receiving fewer than 20 minutes per game, making them potential targets for the savviest of savvy fantasy owners.
Whether because (a) I've been struck by inspiration or (b) I'm just a Lying Liarface from Liarville, this is, in fact, not what I'll be doing -- so, many apologies to the hundredsthousands millions of readers who hang on this column's every word.
Instead, what I'd like to address this week is an issue that I think causes some difficulty for fantasy owners -- namely, the relative value of increases and decreases in different categories.
Because that's about as awkward a way of describing today's topic as possible, let's use an example instead.
Consider the per-game averages of two incredibly fictional players:
Player A: 19.3 PTS, 0.9 3Pt, 5.5 REB, 3.2 AST, 1.0 STL, 0.7 BLK, 46.6 FG%, 78.3 FT%
Player B: 14.5 PTS, 0.9 3Pt, 5.5 REB, 3.2 AST, X.X STL, 0.7 BLK, 46.6 FG%, 78.3 FT%
We see here two players who're identical in almost every way: three-pointers, rebounds, assists, blocks, field-goal percentage, and free-throw percentage. And though they're not listed here, I can assure you, as well, that Players A and B also take exactly the same number of field-goal and free-throw attempts per game.
So the question, then, is this: How many steals per game must Player B average -- in a standard, 12-by-13, eight-category format -- how many steals must he average to compensate for the deficit in points?
The answer? About 1.4 per game.
What about if the steal numbers were the same, and blocks, instead, were the category with which Player B needed to compensate? In that case, how many blocks per game would Player B need.
The answer? About 1.3 per game.
Okay, so here's what that tells us: that 4.8 points equals 0.4 steals equals 0.6 blocks.
Consider this in a different way. Below are 10 players who've been almost equally valuable on a per-game basis this season (again, in the standardest of formats):
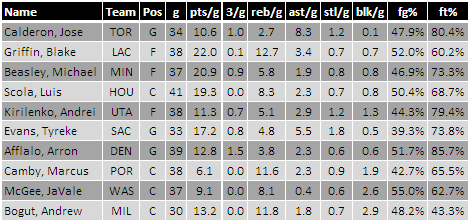
Perhaps this isn't surprising to you, reader. Or perhaps your reaction to this list is something along the lines of "Say wha-?"
Either way, it's true: these players have provided roughly the same value this season. Thanks to his excellent rebound and block numbers, Marcus Camby can score just 6.1 points per game with a 42.7 FG% and be worth about the same as Michael Beasley, who averages about 21 points per game. By shooting the three-ball well, contributing across categories, and scoring efficiently, Denver's Arron Afflalo quietly produces as much in fantasy terms as wunderkindBlake Griffin, whose problems with free-throw shooting (and volume of attempts) hold him back.
It's something that every fantasy owner knows -- i.e. that an increase in one category is not equal in another -- but the exact values are hard to eyeball.
So, how do we do it?
By means of the wonder known as z-scores!
Again, just as with the list above, some readers willn't be shocked by this news. "Come on, Cistulli," they're probably saying to their computer screens this minute, "I thought this was a real-live nerd alert. Bore-ring!" To this group, I can offer only a snappy prose style and the occasional inappropriate joke as consolation.
For other readers -- those less familiar with this area of study -- here's a basic definition of a z-score: a z-score indicates how many standard deviations a data point is above or below the mean in a particular category. What's a standard deviation? Glad you asked. It's basically a number that represents the average variance from the mean -- again, in a particular category.
For example, with the case of Players A and B above, we saw that 0.4 steals equals 0.6 blocks -- this, even though the league average for steals (1.0) is actually higher than that for blocks (0.7). People who watch basketball will have some idea why: while steals are somewhat evenly distributed among all players, blocks are not. A center, for example, is much more likely to average 0.5 steals per game than a point guard is 0.5 blocks per game. Because of this less even distribution, the standard deviation for blocks is higher than for steals. But by saying that both 0.4 steals and 0.6 blocks -- by saying that both are worth approximately one standard deviation -- we're able to get a clearer idea of the relative value of increases and decreases across categories.
By averaging together a player's z-scores in the eight (or however many) relevant fantasy categories, we're also able to understand overall player value. The z-score is at the heart of Andre' Snellings' excellent and constantly updated fantasy basketball cheat sheet here at RotoWire. It's also what one can see (albeit with less editorializing) at the Internet's Basketball Monster.
Finally, we're able to address almost completely the concern I invoked at the beginning of this post, when I looked at the relative values of points, steals, and blocks.
Here are the average numbers in a standard league together with the standard deviation (conveniently denoted as "STD") for each category.
	PTS	3Pt	REB	AST	STL	BLK	FG%	FT%
  AVG	14.5	0.9	5.5	3.2	1.0	0.7	46.6	78.3STD	4.8	0.8	2.7	2.4	0.4	0.6	---	---
"Almost completely," I say. The reader will notice that field-goal and free-throw percentage numbers are absent, as those categories are informed by two variable -- not only the relevant percentage itself, but also by the attempts per game.