






How many of you have heard the old "Running backs are done at age 30" line? As a 10-year fantasy football veteran, I've heard this adage too many times to count, but I always wondered if it were true. I decided to research the data surrounding this topic to determine if there is any truth to this age-old rule of thumb.
Data
The initial data set comprised the top 100 rushers every year from 1961 to 2010 (data gathered from NFL.com). I then applied a minimum standard of 100 rushing attempts in a season to the data set. This captured a total of 673 running backs (RBs). Then, I re-included any season for those 673 players which did not meet the 100 rushing attempts minimum. Thus, the final data set includes 3,767 records from the 673 qualifying RBs.
Analysis of the Data
In order to analyze this data, I required a modeling technique. The technique most suitable for this analysis is called Segmented Piecewise Regression. Essentially, this approach cuts the data set into two segments: RBs younger than 30 and RBs older than 30. Then, a linear regression model is applied to both segments. For those unfamiliar with statistical analysis, a linear regression model is an attempt to find a best fit line (linear) model which appropriately matches the data. When comparing the two linear regression models, the slope of the two lines determines whether there is a significant difference in production before and after the age of 30.
How many of you have heard the old "Running backs are done at age 30" line? As a 10-year fantasy football veteran, I've heard this adage too many times to count, but I always wondered if it were true. I decided to research the data surrounding this topic to determine if there is any truth to this age-old rule of thumb.
Data
The initial data set comprised the top 100 rushers every year from 1961 to 2010 (data gathered from NFL.com). I then applied a minimum standard of 100 rushing attempts in a season to the data set. This captured a total of 673 running backs (RBs). Then, I re-included any season for those 673 players which did not meet the 100 rushing attempts minimum. Thus, the final data set includes 3,767 records from the 673 qualifying RBs.
Analysis of the Data
In order to analyze this data, I required a modeling technique. The technique most suitable for this analysis is called Segmented Piecewise Regression. Essentially, this approach cuts the data set into two segments: RBs younger than 30 and RBs older than 30. Then, a linear regression model is applied to both segments. For those unfamiliar with statistical analysis, a linear regression model is an attempt to find a best fit line (linear) model which appropriately matches the data. When comparing the two linear regression models, the slope of the two lines determines whether there is a significant difference in production before and after the age of 30.
Results
Figure 1 below details the 3,767 records broken down by age category and the corresponding average number of yards for that age group. The figure also includes the number of records which fall into that category.
Figure 1 – Data Sorted by Age vs Average Yards/Season and the Count of the Age
| Age | Avg Yards/Season | # of Records |
| 19 | -3.0 | 1 |
| 20 | 598.0 | 3 |
| 21 | 552.5 | 66 |
| 22 | 542.1 | 305 |
| 23 | 539.7 | 490 |
| 24 | 575.6 | 527 |
| 25 | 562.1 | 496 |
| 26 | 574.0 | 446 |
| 27 | 542.1 | 405 |
| 28 | 524.5 | 322 |
| 29 | 492.3 | 251 |
| 30 | 452.5 | 179 |
| 31 | 449.7 | 114 |
| 32 | 397.8 | 74 |
| 33 | 320.4 | 46 |
| 34 | 328.9 | 24 |
| 35 | 362.5 | 11 |
| 36 | 351.7 | 6 |
| 37 | 505.0 | 1 |
| Total | 533.3 | 3,767 |
While the table accurately depicts the results of the analysis, the chart below summarizes it pictorially, expressing the linear analysis. Chart 1 is the graphical representation of Figure 1. It clearly indicates an answer to the age question.
Chart 1 – Average Yards per Season Versus Age, with the Count of Age data points
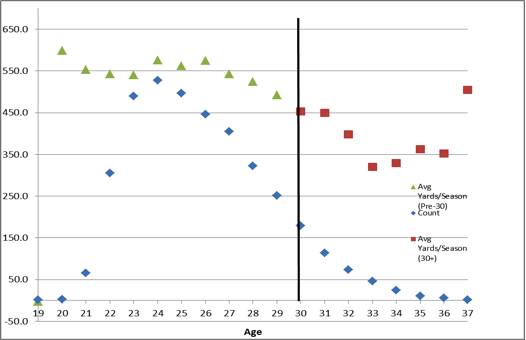
In this graph, there is an obvious downward trend for those RBs past the age of 30. However, the data indicates this downward trend actually begins at age 27 rather than 30. Another factor contributing to this trend is the number of data points in the data set which represent players over the age of 30. Of the 673 players, only 179 players (25 percent) played until the age of 30.
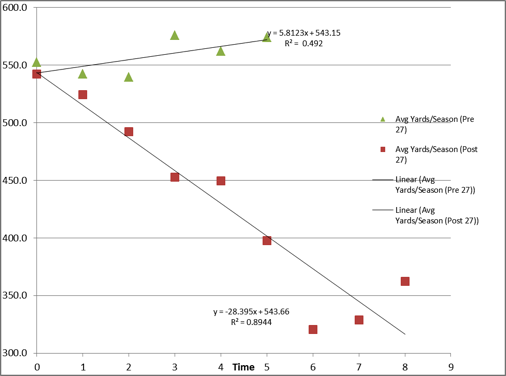
In order to delve further into the quantification of the decline of production of records in RB careers, I used Segmented Piecewise Regression with age 27 being the breaking point, instead of highly discussed 30. For this model, the low and high outliners (ages 19, 20 and ages 36, 37) were removed. The removal of these four ages amounts to the loss of a mere eleven data points.
Chart 2 – Regression Models for Pre-27 and Post-27
Conclusion
What conclusions can we glean from such information? Statistically, an average RB is productive until age 27, and then sees a decline, which then rapidly accelerates at age 30. For practical application in terms of fantasy football, this means three things:
1. Target RBs in the age range of 23 to 26.
2. Be wary of RBs over the age of 27.
3. Be especially wary of RBs over 30 years of age.