Be it spreadsheet-driven, or more by feel, a player's projected value is a function of skills and playing time, seasoned to taste based on team context (venue, quality of lineup, etc.). There is a lot of available information to help measure skills, with regression to expected levels being one of the primary avenues. Playing time, however, remains more art than science.
It can be argued playing time is the most important component of a player's projection. If the skills element is distilled to a per plate appearance basis, the results from the various systems are close. Sure, some are better than others, but the individual player variances are almost always smaller than the projected playing time variances for the player.
Effect of Playing Time
Stating up front valuation methodology is flawed, regardless of the system, observing how a player's projected earnings change via playing time adjustments helps demonstrates how integral playing time is to the drafting process. What follows is how two players are influenced by increasing and decreasing playing time. The data assumes a 15-team mixed league with standard 5x5 scoring. The middle line is my current expectation and projected earnings. It is flanked by adding/subtracting 10 and 20 plate appearances.
Player A
| Rank | AB | H | HR | R | RBI | SB | BA | MIX15 |
| 10 | 587 | 167 | 33 | 105 | 105 | 7 | 0.2845 | $32.40 |
| 12 | 578 | 164 | 32 | 103 | 103 | 7 | 0.2837 | $31.06 |
| 13 | 570 | 162 | 32 | 102 | 102 | 7 | 0.2842 | $30.72 |
| 19 | 561 | 159 | 31 | 99 | 100 | 6 | 0.2834 | $28.78 |
| 19 |
Be it spreadsheet-driven, or more by feel, a player's projected value is a function of skills and playing time, seasoned to taste based on team context (venue, quality of lineup, etc.). There is a lot of available information to help measure skills, with regression to expected levels being one of the primary avenues. Playing time, however, remains more art than science.
It can be argued playing time is the most important component of a player's projection. If the skills element is distilled to a per plate appearance basis, the results from the various systems are close. Sure, some are better than others, but the individual player variances are almost always smaller than the projected playing time variances for the player.
Effect of Playing Time
Stating up front valuation methodology is flawed, regardless of the system, observing how a player's projected earnings change via playing time adjustments helps demonstrates how integral playing time is to the drafting process. What follows is how two players are influenced by increasing and decreasing playing time. The data assumes a 15-team mixed league with standard 5x5 scoring. The middle line is my current expectation and projected earnings. It is flanked by adding/subtracting 10 and 20 plate appearances.
Player A
| Rank | AB | H | HR | R | RBI | SB | BA | MIX15 |
| 10 | 587 | 167 | 33 | 105 | 105 | 7 | 0.2845 | $32.40 |
| 12 | 578 | 164 | 32 | 103 | 103 | 7 | 0.2837 | $31.06 |
| 13 | 570 | 162 | 32 | 102 | 102 | 7 | 0.2842 | $30.72 |
| 19 | 561 | 159 | 31 | 99 | 100 | 6 | 0.2834 | $28.78 |
| 19 | 552 | 157 | 31 | 98 | 99 | 6 | 0.2844 | $28.53 |
Player B
| Rank | AB | H | HR | R | RBI | SB | BA | MIX15 |
| 10 | 608 | 165 | 24 | 93 | 91 | 31 | 0.2714 | $32.58 |
| 10 | 598 | 162 | 24 | 93 | 90 | 31 | 0.2709 | $32.18 |
| 14 | 589 | 160 | 23 | 90 | 88 | 30 | 0.2716 | $30.65 |
| 15 | 580 | 157 | 23 | 89 | 87 | 30 | 0.2707 | $29.99 |
| 17 | 570 | 155 | 22 | 88 | 85 | 30 | 0.2719 | $29.31 |
Before examining the numbers, note that rounding can have an influence on the projected earnings and rankings. Projections are conventionally presented as a whole number. Therefore, 31.501 homers and 32.499 homers are both displayed as 32, even though the difference is .998. Because an individual steal is worth more than a homer, which is worth more than a run or RBI, where the rounding occurs will adjust the earnings disproportionately. For the purpose of this demonstration, the roundoff effect doesn't matter, but it does speak towards the inherent flaws with projection and valuation methodology, and why drafting should not be "take one from the top."
With that in mind, a difference of 40 plate appearances led to a ranking separation of seven and nine places. Forty may seem like a big difference, but it is quite plausible for team managers to have such wide expectations.
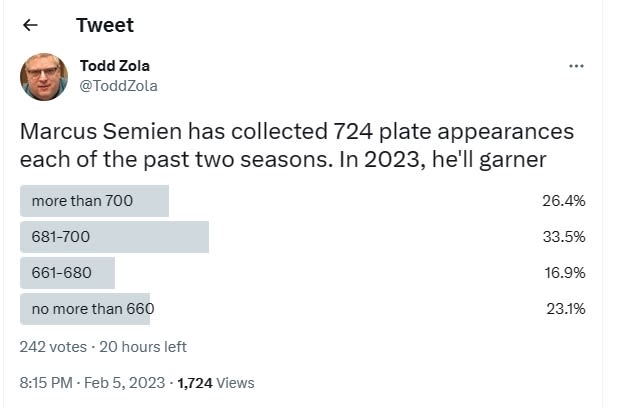
Marcus Semien recorded 703 plate appearances in 2018 and 747 in 2019. He's one of the most consistent and durable players in MLB. Even so, only a quarter of team managers expect at least 700 plate appearances while almost a quarter anticipate at least 40 fewer. If this discrepancy exists for the most reliable player in MLB, similar differences must prevail among the entire inventory.
These two sample players were chosen since their unadjusted expected earnings are $.07 apart, essentially the same. Again, without getting hung up on the actual differences in earnings and rankings, adding plate appearances from one while taking them away from the other altered their relative rankings. Understanding that adding just 10 PAs to one while subtracting 10 from another can flip-flop rankings will hopefully highlight why rankings should not be followed verbatim.
Determination of Plate Appearances
Just like the skills aspect of a projection, the playing time element should be a weighted average of all plausible outcomes. In simpler terms, if the season were played 100 times, the projected playing time is the average of all 100 seasons. Here is a streamlined example for a player averaging 600 plate appearances over the past few seasons.
- Two percent chance of 50 PA
- Three percent chance of 100 PA
- Five percent chance of 500 PA
- Eighty percent chance of 600 PA
- Ten percent chance of 625 PA
Doing the algebra yields 572. A proper calculation almost always renders an amount below the recent average since there is a lot more room to decline than increase.
One of the most difficult players for which to gauge playing time is Aaron Judge. With a repeat of last season's level, he's the clear-cut top fantasy hitter. How risky is it to draft him No. 1? Using my numbers, here is what I have for 692 PA (last season), 633 PA (2021) and an arbitrary 500 PA campaign.
| Rank | PA | AB | H | HR | R | RBI | SB | BA | MIX15 |
| 1 | 692 | 586 | 171 | 48 | 115 | 116 | 10 | 0.2918 | $44.39 |
| 3 | 633 | 537 | 157 | 44 | 106 | 106 | 9 | 0.2924 | $38.59 |
| 25 | 500 | 425 | 124 | 35 | 83 | 84 | 7 | 0.2918 | $24.76 |
Interesting. Judge's healthy numbers are so off the charts, he can lose 60 PA and still merit the third overall pick. However, prior to 2021, 633 would have been considered the top end. Does one full season raise his playing time ceiling significantly? Here is a plausible weighted average array, based on Judge's history. Your mileage may vary.
- Two percent chance of 200 PA
- Five percent chance of 550 PA
- Ten percent chance of 600 PA
- Fifty percent chance of 650 PA
- Thirty-three percent chance of 695 PA
This yields 646 PA, which is about what I have and as you can see on the MLB Roundtable Rankings: 2023 Fantasy Baseball Top 300, I rank Judge third overall.
Here is a tweet from last fall.
In 2022, Aaron Judge collected 692 plate appearance. He compiled 633 in 2021. In 2023, Judge will accrue
— Todd Zola (@ToddZola) October 22, 2022
Considering anything above 633 PA warrants at least a No. 3 pick, this is a great example of how an ADP differs from a ranking list. With one of three drafters ranking Judge worthy of a top-three selection, his ADP with be around 1.03, which is where it currently stands. However, if the rankings from everyone in the pool were to be averaged, Judge would fall well after third overall.
We're veering a little off topic, but Judge as a case study is great example of why injecting your own playing time expectation is crucial to your rankings.
Be Conservative with Expectations
This notion has already been addressed via weighted average and showing there is a lot more room to fall than rise. Let's investigate what has occurred over the past few seasons. Unfortunately, the pandemic season interrupts any reasonable trend analysis, but the message will still be clear.
This study compares how players accumulating "X" PA one season fare the following campaign. Data going back to 2016 was used, yielding four sets of data (2016/2017, 2017/2018, 2018/2019, 2021/2022).
Players within one percent of last season's level are classified as the same. The following ranges were determined, above and below the prior season's mark:
- One to two percent
- Three to five percent
- Five to 10 percent
- 10 to 25 percent
- 25 to 50 percent
- 50-100 percent
- > 100 percent
Summary
| PA | No. Players | Same | More PA | Fewer PA |
| >700 | 30 | 3.3% | 13.3% | 83.3% |
| 676-700 | 62 | 1.6% | 17.7% | 80.6% |
| 651-675 | 54 | 11.1% | 14.8% | 74.1% |
| 626-650 | 72 | 6.9% | 34.7% | 58.3% |
| 601-625 | 71 | 4.2% | 21.1% | 74.6% |
| 576-600 | 79 | 5.1% | 26.6% | 68.4% |
| 551-575 | 55 | 0.0% | 38.2% | 61.8% |
| 501-550 | 145 | 6.2% | 27.6% | 66.2% |
| 451-500 | 132 | 3.0% | 38.6% | 58.3% |
| 401-450 | 117 | 3.4% | 40.2% | 56.4% |
| 326-400 | 199 | 1.0% | 41.7% | 57.3% |
| 251-325 | 215 | 0.0% | 40.5% | 59.5% |
Increased Plate Appearances
| PA | 1-2% | 3-5% | 5-10% | 10-25% | 25-50% | 50-100 | >100 |
| >700 | 0.0% | 6.7% | 6.7% | 0.0% | 0.0% | 0.0% | 0.0% |
| 676-700 | 8.1% | 8.1% | 1.6% | 0.0% | 0.0% | 0.0% | 0.0% |
| 651-675 | 1.9% | 5.6% | 7.4% | 0.0% | 0.0% | 0.0% | 0.0% |
| 626-650 | 6.9% | 11.1% | 12.5% | 4.2% | 0.0% | 0.0% | 0.0% |
| 601-625 | 0.0% | 2.8% | 14.1% | 4.2% | 0.0% | 0.0% | 0.0% |
| 576-600 | 1.3% | 5.1% | 10.1% | 10.1% | 0.0% | 0.0% | 0.0% |
| 551-575 | 1.8% | 0.0% | 10.9% | 21.8% | 3.6% | 0.0% | 0.0% |
| 501-550 | 0.0% | 5.5% | 6.2% | 13.1% | 2.8% | 0.0% | 0.0% |
| 451-500 | 1.5% | 5.3% | 5.3% | 10.6% | 15.9% | 0.0% | 0.0% |
| 401-450 | 0.9% | 1.7% | 2.6% | 12.8% | 17.1% | 5.1% | 0.0% |
| 326-400 | 0.5% | 2.0% | 4.5% | 12.6% | 10.6% | 10.1% | 1.5% |
| 251-325 | 0.0% | 2.8% | 3.3% | 7.0% | 9.3% | 11.6% | 6.5% |
Decreased Plate Appearances
| PA | 1-2% | 3-5% | 5-10% | 10-25% | 25-50% | 50-100 | >100 |
| >700 | 0.0% | 20.0% | 23.3% | 23.3% | 6.7% | 10.0% | 0.0% |
| 676-700 | 11.3% | 16.1% | 8.1% | 14.5% | 17.7% | 12.9% | 0.0% |
| 651-675 | 3.7% | 5.6% | 14.8% | 31.5% | 9.3% | 7.4% | 1.9% |
| 626-650 | 1.4% | 6.9% | 11.1% | 20.8% | 11.1% | 5.6% | 1.4% |
| 601-625 | 4.2% | 11.3% | 7.0% | 22.5% | 19.7% | 9.9% | 0.0% |
| 576-600 | 0.0% | 6.3% | 8.9% | 22.8% | 16.5% | 13.9% | 0.0% |
| 551-575 | 0.0% | 1.8% | 1.8% | 18.2% | 30.9% | 9.1% | 0.0% |
| 501-550 | 0.7% | 3.4% | 7.6% | 10.3% | 13.8% | 20.7% | 9.7% |
| 451-500 | 0.0% | 3.8% | 4.5% | 9.8% | 18.9% | 13.6% | 7.6% |
| 401-450 | 0.0% | 2.6% | 3.4% | 12.0% | 17.9% | 18.8% | 1.7% |
| 326-400 | 1.5% | 1.0% | 3.0% | 6.5% | 15.1% | 19.1% | 11.1% |
| 251-325 | 0.5% | 0.5% | 2.8% | 4.7% | 14.9% | 24.2% | 12.1% |
Observations
- Players accruing at least 600 plate appearances have about a 75 percent chance of falling short of the previous season's total.
- Players in the 325-450 PA range still have a greater than 50 percent chance to trail last season's total, but they are the most likely to play more, hence are a target group for later speculative options.
- Expecting a batter to gain plate appearances is fine, just keep the overall number in check. For every player you anticipate playing more, three others should fall short of the previous year's trips to the dish.
The 700 Club
One of the main messages is not to go overboard with playing time expectations, while reiterating that the pandemic season puts the kibosh on more studies of this nature, since recent results are most applicable. Looking at players with at least 700 plate appearances serves as a good reminder that each hitter deserves his own, unbiased analysis.
Intuitively, those with 700 PA are most likely to lag last season's total, and the above tables support the notion. Since 2016, a player has reached at least 700 PA 41 times. However, only 30 individuals have achieved the lofty total, with the following six players doing it multiple times: Marcus Semien (4), Francisco Lindor (3), Mookie Betts (3), Whit Merrifield (3), Freddie Freeman (2) and Trea Turner (2),
Ideally, the next study would be how many did it twice in a row, but 2020 throws a wrench into those plans. Still, the fact 20 percent of those eclipsing 700 PA have done it at least twice since 2016 indicates those with that lofty number deserve consideration to do it again.
Semien, Freeman, Turner, Lindor and Vladimir Guerrero all registered at least 700 PA last year. All but Guerrero have already done it.
Matt Olson, Bo Bichette, Dansby Swanson, Aaron Judge and Austin Riley all came with 10 PA of joining the 700 Club.
You can't win a league in the first round, blah blah blah, woof woof woof. However, determining which two or three of the 10 players just cited will amass close to 700 PA could go a long way towards drafting a first round foundation piece for your roster.