
All [insert name of hitter here] needs to do is strike out less frequently. Easy for me to say.
It's the time of the year we're all evaluating batters, with their contact rate under scrutiny. We'll make draft (or keeper) decisions hoping a player maintains an improved strikeout rate, or in some cases, we take the leap of faith his contact will improve.
Of course, every case is different. However, an integral aspect of projection theory is analyzing how skills progress from one year to the next. That is, in the aggregate, how do players exhibiting a similar skill fare the following season?
For example, a player's strikeout dropped from 33 percent the prior season to 28 percent the next season. How many batters with a similar improvement maintained the gains the following season? How many improved even more, and how many reverted to something like their past level?
What follows is an examination of batters' strikeout rates over the past three seasons. It sure would be nice to include 2020, but, well, you know. Individual strikeout rate will be discussed, but the objective is not to focus on them but to search for common threads to help evaluate players with similar trends for the upcoming season. In order to make the cut, a batter needs at least 400 plate appearances in consecutive seasons. For a point of reference, here are some league averages, all courtesy of Fangraphs.
| Season | K% | O-Swing% | Z-Swing% | Swing% | O-Contact% | Z-Contact% | CStr% |
|---|---|---|---|---|---|---|---|
| 2023 | 22.7% | 31.9% |
All [insert name of hitter here] needs to do is strike out less frequently. Easy for me to say.
It's the time of the year we're all evaluating batters, with their contact rate under scrutiny. We'll make draft (or keeper) decisions hoping a player maintains an improved strikeout rate, or in some cases, we take the leap of faith his contact will improve.
Of course, every case is different. However, an integral aspect of projection theory is analyzing how skills progress from one year to the next. That is, in the aggregate, how do players exhibiting a similar skill fare the following season?
For example, a player's strikeout dropped from 33 percent the prior season to 28 percent the next season. How many batters with a similar improvement maintained the gains the following season? How many improved even more, and how many reverted to something like their past level?
What follows is an examination of batters' strikeout rates over the past three seasons. It sure would be nice to include 2020, but, well, you know. Individual strikeout rate will be discussed, but the objective is not to focus on them but to search for common threads to help evaluate players with similar trends for the upcoming season. In order to make the cut, a batter needs at least 400 plate appearances in consecutive seasons. For a point of reference, here are some league averages, all courtesy of Fangraphs.
| Season | K% | O-Swing% | Z-Swing% | Swing% | O-Contact% | Z-Contact% | CStr% |
|---|---|---|---|---|---|---|---|
| 2023 | 22.7% | 31.9% | 68.8% | 47.4% | 62.3% | 85.4% | 16.4% |
| 2022 | 22.4% | 32.6% | 69.1% | 47.7% | 63.5% | 85.4% | 16.4% |
| 2021 | 23.2% | 31.3% | 69.0% | 47.2% | 62.4% | 84.7% | 16.4% |
KEY
- K%: Strikeouts per Plate Appearance
- O-Swing%: Swings at pitches outside the zone divided by pitches seen outside the zone
- Z-Swing%: Swings at pitches inside the zone divided by pitches seen inside the zone
- Swing%: Swings divided by total pitches seen
- O-Contact%: Contact made outside the zone divided by swings outside the zone
- Z-Contact%: Contact made inside the zone divided by swings inside the zone
- CStr%: Called Strike percentage
There are only 95 players with at least 400 plate appearances each of the past three seasons. Of those, just 13 fanned at least 26 percent of the time in 2021. Let's see what happened to them over the ensuing two seasons.
Strikeout Rate (K%)
| Player | 2021 | 2022 | 2023 |
|---|---|---|---|
| Javier Baez | 33.6% | 24.9% | 22.9% |
| Matt Chapman | 32.5% | 27.4% | 28.4% |
| Adolis Garcia | 31.2% | 27.9% | 27.7% |
| Eugenio Suarez | 29.8% | 31.2% | 30.8% |
| Shohei Ohtani | 29.6% | 24.2% | 23.9% |
| Ian Happ | 29.2% | 23.2% | 22.1% |
| Willson Contreras | 28.6% | 21.1% | 22.4% |
| Randy Arozarena | 28.1% | 24.2% | 23.9% |
| Willy Adames | 28.1% | 26.9% | 25.9% |
| Ryan Mountcastle | 27.5% | 25.3% | 22.8% |
| Giancarlo Stanton | 27.1% | 30.3% | 29.9% |
| Kyle Schwarber | 27.0% | 29.9% | 29.9% |
| Alec Bohm | 26.6% | 17.4% | 15.4% |
The blue highlight indicates the rate is lower than the previous season. For those curious, if the rates are normalized to the corresponding league average, the results don't change.
Ten players fanned at a lower clip in 2022, and of those eight continued the trend last season. Let's see how those eight players achieved the better contact.
Chase Rate (O-Swing%)
| Player | 2021 | 2022 | 2023 |
|---|---|---|---|
| Javier Baez | 46.6% | 48.7% | 46.0% |
| Adolis Garcia | 39.7% | 40.3% | 33.0% |
| Shohei Ohtani | 30.2% | 32.0% | 33.3% |
| Ian Happ | 26.3% | 30.7% | 26.8% |
| Randy Arozarena | 28.8% | 33.4% | 30.0% |
| Willy Adames | 31.6% | 33.7% | 35.6% |
| Ryan Mountcastle | 41.5% | 41.0% | 41.2% |
| Alec Bohm | 30.9% | 35.4% | 34.3% |
Drawing a broad-brush conclusion on eight hitters is a slippery slope, but chasing less seems like an obvious means of reducing strikeouts. However, it clearly isn't the primary explanation for the performances of this small group.
O-Contact%
| Player | 2021 | 2022 | 2023 |
|---|---|---|---|
| Javier Baez | 53.1% | 55.3% | 58.2% |
| Adolis Garcia | 55.4% | 59.3% | 58.5% |
| Shohei Ohtani | 52.8% | 62.5% | 56.5% |
| Ian Happ | 52.6% | 62.1% | 63.3% |
| Randy Arozarena | 58.8% | 63.8% | 63.7% |
| Willy Adames | 54.2% | 59.5% | 56.5% |
| Ryan Mountcastle | 60.1% | 62.4% | 62.4% |
| Alec Bohm | 68.9% | 72.7% | 74.6% |
Now we're getting somewhere. All eight batters made better contact on pitchers outside the zone in 2022. However, only three continued the trend and Happ just barely improved. Three hitters essentially maintained the improvement, while the last two gave back some of the gains. All eight improved the O-Contact% from 2021 to 2023. Even so, these results don't explain how Ohtani and Adames fanned at a lower rate from 2022 to 2023.
Z-Contact%
| Player | 2021 | 2022 | 2023 |
|---|---|---|---|
| Javier Baez | 73.4% | 81.6% | 82.0% |
| Adolis Garcia | 78.2% | 76.9% | 78.9% |
| Shohei Ohtani | 77.3% | 81.8% | 81.4% |
| Ian Happ | 79.9% | 83.7% | 84.5% |
| Randy Arozarena | 76.0% | 81.1% | 78.9% |
| Willy Adames | 79.0% | 83.6% | 83.5% |
| Ryan Mountcastle | 79.8% | 80.8% | 85.9% |
| Alec Bohm | 80.3% | 87.1% | 90.7% |
Four of the eight made better contact on strikes for consecutive seasons. Two hitters didn't improve in 2023, but they maintained their 2022 level. Arozarena gave back half of his gains. Garcia initially dropped, then reverted his previous level. It's looking like there are a couple different explanations for the two-year improvement pattern, or a least a couple different contributing factors. Let's look at how aggressive each was on strikes.
Z-Swing%
| Player | 2021 | 2022 | 2023 |
|---|---|---|---|
| Javier Baez | 77.4% | 69.1% | 69.3% |
| Adolis Garcia | 75.5% | 75.5% | 74.3% |
| Shohei Ohtani | 72.0% | 74.5% | 70.7% |
| Ian Happ | 68.7% | 74.6% | 68.7% |
| Randy Arozarena | 67.5% | 65.6% | 63.5% |
| Willy Adames | 73.6% | 72.5% | 73.7% |
| Ryan Mountcastle | 77.4% | 81.5% | 77.0% |
| Alec Bohm | 74.8% | 73.8% | 70.1% |
The shaded blue indicates a more aggressive approach. Since Z-Contact% is higher then overall strikeout rate, being more aggressive within the zone should improve the strikeout rate, provided it doesn't significantly reduce Z-Contact%. That said, it doesn't appear swinging at more strikes drove a lower strikeout rate.
Let's verbalize what each of our eight subjects did to fan less.
- Javier Baez: Less aggressive within the zone while making better contact on strikes.
- Adolis Garcia: Initially increased O-Contact%, then maintained the improvement and chased less.
- Shohei Ohtani: Increased his contract rates in and out of the zone, then maintained them.
- Ian Happ: Increased his contract rates in and out of the zone, then maintained them.
- Randy Arozarena: Increased his contract rates in and out of the zone, then maintained them, but also was slightly less aggressive.
- Willy Adames: Increased his contract rates in and out of the zone, then maintained them.
- Ryan Mountcastle: First improved O-Contact%, then Z-Contact%.
- Alec Bohm: Chased more and improved O-Contact%, maintained Z-Swing% but improved Z-Contact%
Sure, there are some similarities, but there isn't any common thread, which is what is needed to make anything actionable in such a small sample. Remember, Bill James taught us extremes can be real in limited samples.
The main reason for doing this study, even though there were only eight qualifying subjects, is that more projections start with a three-year weighted average for a foundation. The missing piece to this study is how well does a standard three-year average project strikeout rate, but we don't have 2020 data (60 games is too noisy) to see how well 2020-2022 strikeout rates projected 2023 rates. Going back to study how well 2016-2018 projected 2019 may not reflect what to expect in 2024.
The key is everything does not have to be subject to the same weighted average. Let's use a 5:4:3 weighted average, with more emphasis on the past season and project Alec Bohm's strikeout rate for 2024:
((15.4% x 5) + (17.4% x 3) + (26.6% x 3))/15 = 16.3%
Wouldn't it be nice to know if players with Bohm's three-year pattern of improving strikeout rate kept improving? Or even maintained the third season's rate? Granted, using 16.3 percent isn't going to crush a projection following a season with a 15.4 percent level, and serves to illustrate the utility of a three-year average as it accounts for something occurring to reverse the trend. After all, the Marcel (yes, from Friends) projection system is named as such because it's so easy, even a monkey can do it.
Let's expand the study to a larger pool and investigate how strikeout rate changes one year to the next using rolling averages. Every player gathering at least 400 plate appearances for two straight seasons will be included. The numbers on the X-Axis represent each rolling group of 11 players.
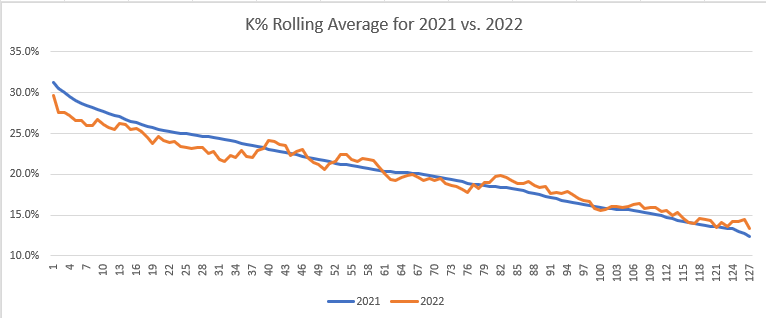
Players with a strikeout north of 26 percent improved the following season while those below 19 percent punched out a bit more. This could be nothing more than regression to the mean. The average of 26 and 19 is 22.5, which almost matched the typical league strikeout rate.
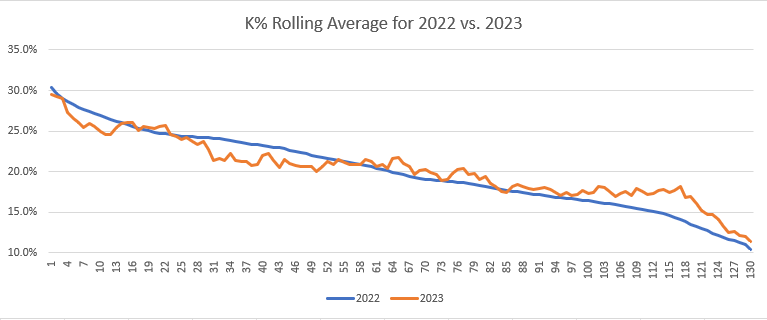
There is a bit more noise in the data from the past two season, but the trend is similar. High rates drop and low rates increase.
The final chart compared 2021 to 2023.
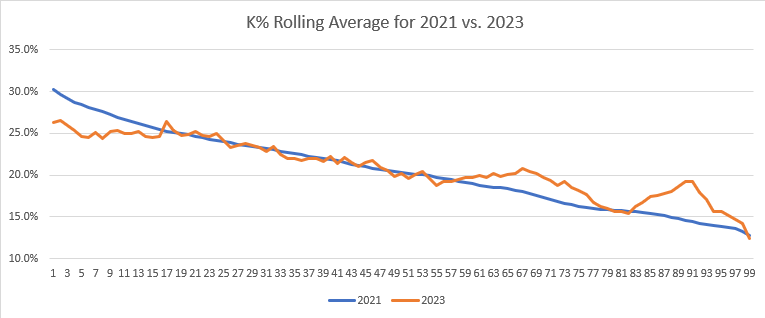
Regression to the mean is again apparent. The main takeaway from these graphs is the extremes will move towards the mean, and it isn't necessarily a change in skill as much as natural regression. It's fair to expect those with high strikeout rates in 2023 to drop a few points. even without a change in approach.
With 2020 finally in the rearview mirror, a cool study for next October will be to reverse engineer how 2021-2023 numbers projected 2024 results.