
There's been a lot of talk about the lower run environment this season, with MLB seemingly tinkering with the ball yet again and implementing a version that doesn't fly as far. Comparing this season's numbers to previous years is always somewhat dangerous, however, as the run environment changes within each season as the weather heats up.
Now that April is fully behind us, though, we can make a nice, clean comparison to how things looked in previous Aprils. The following table reveals how the game compares to the last five seasons in which April ball was played across a number of metrics:
| Year | AVG | OBP | SLG | OPS | K% | BB% | HR% | SB/PA | ERA | WHIP |
|---|---|---|---|---|---|---|---|---|---|---|
| 2022 | .231 | .306 | .369 | .675 | 23.0 | 8.9 | 2.4 | 0.013 | 3.71 | 1.24 |
| 2021 | .232 | .309 | .390 | .699 | 24.4 | 8.8 | 3.1 | 0.012 | 3.99 | 1.25 |
| 2019 | .246 | .322 | .423 | .745 | 23.3 | 9.1 | 3.5 | 0.013 | 4.36 | 1.33 |
| 2018 | .245 | .320 | .401 | .721 | 22.7 | 9.0 | 2.8 | 0.013 | 4.14 | 1.31 |
| 2017 | .247 | .317 | .407 | .725 | 21.6 | 8.7 | 3.0 | 0.014 | 4.09 | 1.30 |
| 2016 | .249 | .319 | .405 | .724 | 21.3 | 8.6 | 2.8 | 0.013 | 3.98 | 1.31 |
There are a few things to note here. First, you'll notice that while league-wide OPS is indeed down, the reduced batting averages this year aren't entirely new, as we saw effectively the same figure last April -- you might remember the hand-wringing about whether no-hitters were even cool anymore. Averages over the last two seasons are far below what they were in the late 2010s, but it's at least not entirely
There's been a lot of talk about the lower run environment this season, with MLB seemingly tinkering with the ball yet again and implementing a version that doesn't fly as far. Comparing this season's numbers to previous years is always somewhat dangerous, however, as the run environment changes within each season as the weather heats up.
Now that April is fully behind us, though, we can make a nice, clean comparison to how things looked in previous Aprils. The following table reveals how the game compares to the last five seasons in which April ball was played across a number of metrics:
| Year | AVG | OBP | SLG | OPS | K% | BB% | HR% | SB/PA | ERA | WHIP |
|---|---|---|---|---|---|---|---|---|---|---|
| 2022 | .231 | .306 | .369 | .675 | 23.0 | 8.9 | 2.4 | 0.013 | 3.71 | 1.24 |
| 2021 | .232 | .309 | .390 | .699 | 24.4 | 8.8 | 3.1 | 0.012 | 3.99 | 1.25 |
| 2019 | .246 | .322 | .423 | .745 | 23.3 | 9.1 | 3.5 | 0.013 | 4.36 | 1.33 |
| 2018 | .245 | .320 | .401 | .721 | 22.7 | 9.0 | 2.8 | 0.013 | 4.14 | 1.31 |
| 2017 | .247 | .317 | .407 | .725 | 21.6 | 8.7 | 3.0 | 0.014 | 4.09 | 1.30 |
| 2016 | .249 | .319 | .405 | .724 | 21.3 | 8.6 | 2.8 | 0.013 | 3.98 | 1.31 |
There are a few things to note here. First, you'll notice that while league-wide OPS is indeed down, the reduced batting averages this year aren't entirely new, as we saw effectively the same figure last April -- you might remember the hand-wringing about whether no-hitters were even cool anymore. Averages over the last two seasons are far below what they were in the late 2010s, but it's at least not entirely unique to this season.
The way we've gotten to that batting average has changed, however. League-wide strikeout rates have dropped 1.4 points, and now sit evenly between the 2018 and 2019 numbers. You'd think that would lead to more hits, but it's been counterbalanced by a clear decrease in power, with slugging percentage dropping 21 points and home run rates dropping precipitously. Interestingly, teams haven't been stealing more bases to make up for the fact that first base doesn't count as effectively being in scoring position like it has for the past several years. Whether that will change as managers and analytics departments adjust to the new reality will be interesting to follow.
So what do we do to adapt to this strange new world? Probably not a ton, as leaguewide trends by definition affect the entire league. The one category of player that seems to be affected more than others is hitters with fringy power. Several such players produced surprising home run totals when home run rates peaked in 2019 and haven't showed close to that same level of pop since. See Gleyber Torres for perhaps the most noteworthy example. He homered in 6.3 percent of his plate appearances that season but has homered just 1.9 percent of the time since the start of 2020.
Outside of slightly reducing power expectations for those hitters, the main thing we should be doing is recalibrating our expectations for what counts as a strong performance. I've had to catch myself in that regard several times recently, having been in the process of writing about a hitter's "disappointing" line only to realize that it translates to a 110 wRC+. Those plus stats, which adjust a metric for both park factors and the overall offensive environment, are perhaps more important than ever to familiarize yourself with if scoring is going to continue to change from year to year. It's important to know what actually counts as a good performance, not just one that looks like one compared to the numbers we're used to seeing. We'll use those metrics and others to break down this week's set of risers and fallers, which includes a number of young players who look like they're jumping to the next level.
RISERS
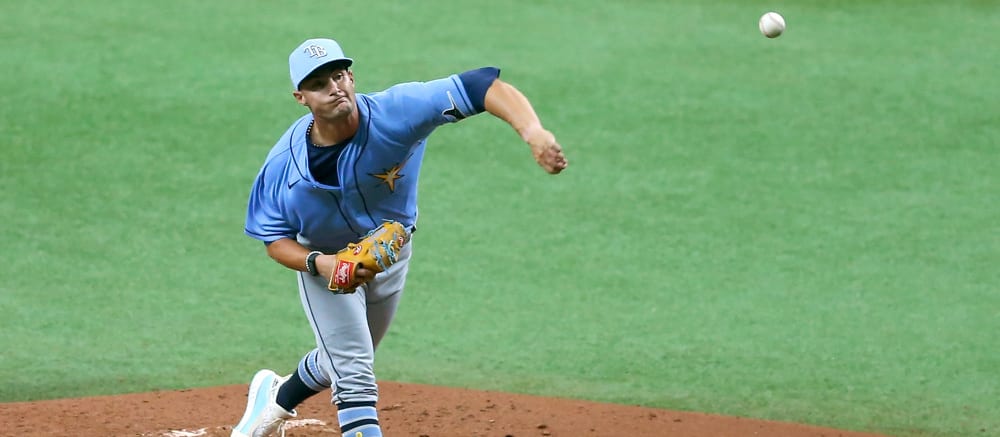
 Shane McClanahan, SP, Rays: The McClanahan we saw last season was a very promising young rookie, as he rode a 27.3 percent strikeout rate and better than average walk and groundball numbers to a 3.43 ERA. The McClanahan we've seen so far this year is a Cy Young Candidate. He trails only Carlos Rodon among qualified pitchers in strikeout rate with a mark of 39.3 percent and sits fifth among that group with a 56.1 percent groundball rate. Toss in his 6.5 percent walk rate and you get a pitcher whose 1.59 xFIP suggests his 3.00 ERA is actually a significant underachievement. The young lefty has more than doubled the use of his splitter and now throws four different pitches at least 17.8 percent of the time, led by a fastball he turns to for just 35.7 percent of his pitches. He's been a bit unlucky with his 26.7 percent HR/FB rate (the league average this year is just 10.1 percent), so some positive regression there should cancel out any steps back elsewhere if he's unable to maintain quite this impressive of a performance.
 Gavin Lux, 2B/SS, Dodgers: Lux was one of the top prospects in baseball when he debuted at age 21 back in 2019, but he didn't show all that much in his first three years in the league. In 532 plate appearances from 2019 to 2021, he homered a modest 12 times while slashing .233/.314/.368 and managing just a 4.6 percent barrel rate. This year, he seems to be finally delivering on his promise. The decision to trade away AJ Pollock for Craig Kimbrel has finally opened up a near-everyday role for Lux, and he's taken advantage of the opportunity by slashing .259/.349/.370. That line may look modest on the surface, but that's due to the suppressed scoring environment mentioned in the introduction, as it's good for a 115 wRC+. His underlying numbers suggest he deserves far better, as he owns a .314 xBA and .520 xSLG thanks to his 11.1 percent barrel rate. Not only is he hitting the ball much harder, he's seeing it far better, as both his 12.7 percent walk rate and 15.9 percent strikeout rate represent career bests.
 Eric Lauer, SP, Brewers: Lauer was fine enough through his first four major-league seasons, but he wasn't a particularly notable pitcher. Through the end of last season, he owned a 4.28 ERA and a 21.5 percent strikeout rate. Even last year, when he finished with a strong 3.19 ERA, it came with a merely average 23.9 percent strikeout rate and a forgettable 4.04 FIP. He looks like an entirely different pitcher through four starts this season. After striking out 13 Phillies and 11 Cubs in his last two starts, he now owns a 36.6 percent strikeout rate. He's paired that with a 5.4 percent walk rate, leading to a 1.93 ERA. That improvement is backed by changes in his arsenal, as he's increased his fastball velocity from 92.6 mph to 94.0 but has also decreased its usage, throwing it just 35.7 percent of the time while adding more sliders, cutters and curves. There's one potential red flag here in that his very low 28.8 percent groundball rate could foreshadow future homer problems, but on the whole Lauer appears to be emerging as a potential frontline arm.
 MacKenzie Gore, SP, Padres: The development path for a pitching prospect is seldom straightforward. Take a look at this list of the top 10 pitching prospects from as recently as 2020 according to FanGraphs:
| Pitcher | Notes |
|---|---|
| MacKenzie Gore | Struggled at alternate site in 2020; demoted all the way to the complex level in 2021 to rediscover his form. |
| Jesus Luzardo | Walk rate spiked to 11.0 percent last season as ERA jumped to 6.61. |
| Nate Pearson | Has been on verge of rotation since 2020 but owns a 5.18 ERA in 33 MLB innings while battling multiple injuries. |
| Matt Manning | Has a 5.50 ERA and 14.7 K% through 20 MLB starts. |
| Dustin May | Underwent Tommy John surgery in May of 2021. |
| Forrest Whitley | Has thrown just 86 innings since start of 2018 due to multiple injuries, including Tommy John surgery in March of last year. |
| Casey Mize | Decent 4.29 ERA in 39 MLB starts comes with 4.95 FIP and 18.7 percent strikeout rate; currently out with elbow sprain. |
| Brendan McKay | Missed 2020 with COVID-19 and shoulder surgery; made just seven minor-league starts in 2021 due to shoulder and elbow injuries; currently out with sore shoulder. |
| Luis Patino | Owns a 4.53 ERA in 95.1 MLB innings; on 60-day IL due to oblique strain. |
| Michael Kopech | Missed 2019 due to Tommy John surgery; opted out of 2020 season; worked mostly in bullpen in 2021. |
None of this is intended to cast any shade on FanGraphs nor Eric Longenhagen, both excellent resources. The point here is instead to highlight just how difficult it is for even a top pitching prospect to seamlessly transition to the majors. Not a single one of these elite young arms managed to do so. In that context, Gore is a riser simply for being here. Not only has he finally made it, though, he's thrived, with his 1.76 ERA and 32.3 percent strikeout rate looking exactly like what you'd hope to see from a top pitching prospect's first three starts. San Diego's rotation is about to get crowded once Mike Clevinger (knee) and Blake Snell (groin) return from the injured list, but Gore has made his case to continue earning opportunities.
 Taylor Ward, OF, Angels: Ward was almost a complete afterthought during draft season, with drafters seemingly only having eyes for younger options Jo Adell and Brandon Marsh for the two spots alongside Mike Trout even after Justin Upton was released. Ward only played in 64 games last season, but his .250/.332/.438 line (good for a 111 wRC+) and 10.3 percent barrel rate arguably should have garnered more attention. Even those who did look his way are probably shocked with how his season has started off, however. He missed the first eight games of the year with a groin injury but has been an everyday starter since then, hitting .400/.507/.764 through 15 contests while homering five times. He's shown excellent plate discipline, with his strikeout and walk rates both sitting at 17.9 percent, and his quality of contact has been fantastic, as seen in his 16.3 percent barrel rate. The 28-year-old won't keep up this amazing hot streak, but there's not a whole lot of unearned good fortune in his numbers, so it's time we start thinking of him as a much more interesting player.
 Alec Bohm, 3B, Phillies: After a promising debut in 2020, Bohm looked lost at the plate last season, hitting .247/.305/.342 with just seven homers in 115 games, a line that came with a 26.6 percent strikeout rate and a 6.6 percent barrel rate. Combined with his poor defense at the hot corner, it seemed fair to wonder if the 2018 third-overall pick had a future as an everyday player. Those defensive concerns remain, as he had a three-error game earlier in the season that led to him expressing his frustration with playing in Philadelphia, but he's won back the fans with some excellent performances at the plate. Through 21 games, he's slashing .309/.373/.455, and his .367 xBA and .640 xSLG suggest that he's actually been quite unlucky. Contact was supposed to be his carrying tool, and he's demonstrated that by cutting his strikeout rate to 14.9 percent, but he's also hitting the ball harder, producing a 10.2 percent barrel rate. There's room for more growth if he can raise his 7.9 degree average launch angle, but that's the lone blemish on an otherwise excellent start.
FALLERS
 Ketel Marte, 2B/OF, Diamondbacks: Marte did finally manage his first homer of the year Saturday and has one hit in each of his last three games, but his .151/.213/.279 season slash line remains very poor. His .194 BABIP suggests he's getting quite unlucky, and he's underperformed his xBA by 57 points, but it's not as if matching his .208 mark in that category would count as an acceptable start to the season. Everything seems off with him, judging by his underlying numbers. After posting an 8.9 percent barrel rate last year, he's managed a barrel rate of just 3.2 percent so far this season. Not only is he making weaker contact, he's also making far less frequent contact, as his 25.5 percent strikeout rate is well above his 16.0 percent mark from last season. It doesn't seem as though he's seeing the ball well, as his 35.7 percent swing rate on pitches outside the zone is well above his career average of 27.6 percent.
 Franmil Reyes, DH, Guardians: Strikeout problems have always been part of Reyes' profile. Through his first four seasons, he whiffed 29.5 percent of the time, but he still managed a .260/.325/.503 slash line (good for a 110 wRC+) thanks to his 14.1 percent barrel rate. His strikeout rate jumped to 32.0 percent last season, but that came with a career-best 16.9 percent barrel rate, helping him to a strong 125 wRC+. There's a limit to how often you can strike out while remaining successful, though, and Reyes has blown far past it. Through 19 games, he's struck out in a whopping 46.3 percent of his plate appearances. His barrel rate of 12.2 percent is still solid, but that matters a lot less when a player is barely putting the ball in play, as seen by the fact that he's managed just a .139/.171/.215 slash line despite that mark. The pressure is even higher on Reyes' bat given that he's almost exclusively a designated hitter, so it would hardly be a surprise if he starts to lose playing time.
 Jose Urquidy, SP, Astros: Urquidy has always had his fair share of fans, though I've never quite seen the appeal. Yes, he had a 3.55 ERA in 34 outings prior to this season, but that looked unsustainable judging by his 4.13 FIP and 4.53 xFIP, as his strong 4.8 percent walk rate shouldn't have been enough to reliably overcome a low strikeout rate (20.8 percent) and groundball rate (33.9 percent). He's been a similar version of himself according to those metrics through his first four starts this year, though he's taking it to an even greater extreme. He's cut his walk rate still further to 3.5 percent, but his strikeout rate has fallen to 15.1 percent while his groundball rate has dropped to 29.4 percent. Allowing that much contact isn't a recipe for success, especially when so much of that contact is in the air. His ERA now sits at 5.95, while his xERA, which factors in the quality of the contact he's allowed, sits all the way up at 7.13.
 Bobby Dalbec, 1B, Red Sox: You have to be Joey Gallo to succeed with the 34.4 percent strikeout rate Dalbec posted last season, though his 20.2 percent barrel rate suggested that he had a legitimate shot to carve out a career as a right-handed version of the Yankee slugger. Toss in the fact that Dalbec struck out a respectable 26.2 percent of the time over his final 43 games last year and it looked as though betting on him to perform well enough to maintain a regular role even after the eventual arrival of Triston Casas was a risk worth taking. Instead, Dalbec lost his everyday job by the end of April, and it's not even Casas who's stolen his job but rather 27-year-old Franchy Cordero and his lifetime .660 OPS. Dalbec has actually slightly improved his strikeout rate to 30.7 percent, but his power has disappeared, as he owns an unremarkable 8.7 percent barrel rate. That's led to a .147/.213/.235 slash line and a role on the short side of a platoon.